The Australian greasy wool market is reported on in Australian dollar terms, which makes sense. However the vast majority of Australian wool is exported, with 80% going to China for at least early stage processing before a large proportion of the Australian clip then spreads out across the world. This article takes a look at how our wool market can appear to be quite different depending on the exchange rate being used.
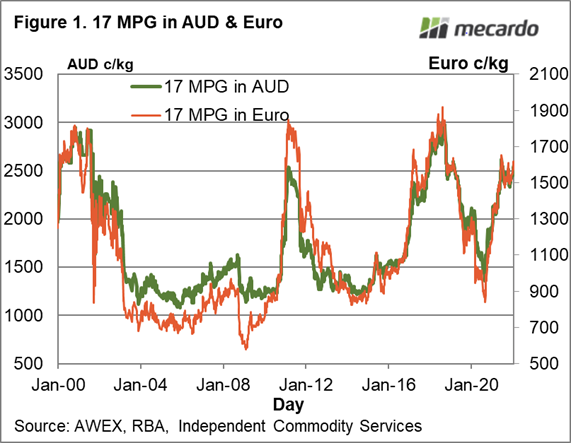
Recent wool reports have highlighted stronger buying by Europeans, who tend to focus on the finer half of the merino micron distribution. Figure shows the 17 MPG in both AUD and Euro terms from 2000 onwards. The two price series tend to follow similar cycles and trends quite closely, occasionally getting out of alignment. The story from Figure 1 is that what we see in Australian dollar terms as far as rising and falling cycles is repeated in Euro terms.
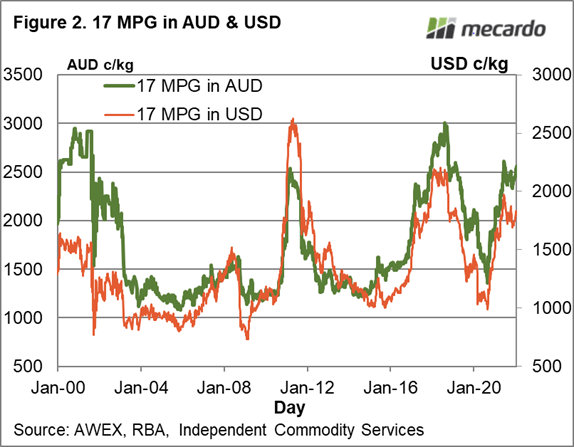
A sizeable proportion of the Australian clip is reported to be consumed at the retail level in China, so for this wool the US dollar exchange rate is important. Figure 2 compares the 17 MPG in Australian dollar and US dollar terms from 2000. While the cycles and trends are common to the two series there are periods when the value gets out line with the periods around 2000 and in 2011 good examples. In these times wool in US terms was cheap when it appeared expensive in local terms (2000) and extremely expensive when it looked only expensive in local terms (2011). The story of whether wool is expensive or cheap can vary markedly depending on the currency used.
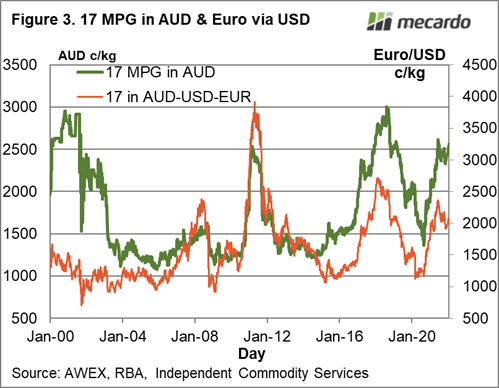
Now back to the Europeans who also buy semi-processed wool out of China. In this case the Europeans will be buying wool using the Euro to US dollar exchange rate. Figure 3 shows the 17 MPG from 2000 onwards in Australian dollar terms and also in Euro-US dollar terms (called AUD-USD-EUR). It is an interesting schematic as it shows the level of the 17 MPG varies between the two series markedly. The bull market in fine wool in 2000 was not so strong, the 2011 market was still very expensive and the 2018 market was nowhere as strong as it seemed in Australian dollar terms. Note also that the 2018 market peaked for the Euro-USD series in early 2018, earlier than in AUD or USD.
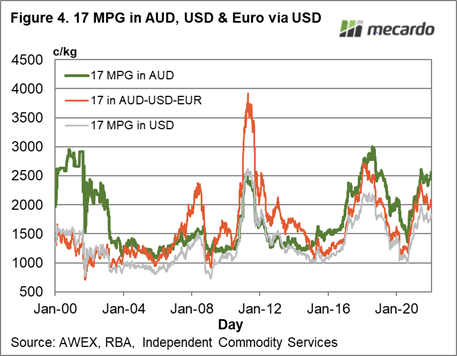
Finally, at the risk of causing gazed eyes, all three 17 micron series are shown in Figure 4 on the same scale, running from 2000 onwards to last week. Now you can put yourself in the place of European and Chinese users of fine Australian merino wool and see how they will be interpret the 17 MPG.

What does it mean?
Australian farm production is responsive to changes in relative commodity prices. The change in the quality of the Australian merino clip and the expansion of prime lamb production during the past three decades are good examples of this. In some strong price cycles, exchange rates play a larger than normal role which can mask the actual demand signal in the market, so it is worthwhile checking price levels in some of the other key currencies to see if the stories match up.
Have any questions or comments?
Key Points
- Exchange rates can impact on whether wool is expensive or cheap.
- European users of wool buy semi-processed wool out of China so the Euro to USD exchange rate becomes important in determining where wool is cheap or expensive.
- It pays to check wool prices levels in these other currencies to make sure it is not simply our floating exchange rate which is driving the wool price.
Click on figure to expand
Click on figure to expand
Click on figure to expand
Data sources:
AWEX, RBA, ICS, Mecardo
