
Since mid-2018, when apparel fibre prices peaked and started a down cycle, farmer greasy wool stocks have grown in Australia. An exact idea of the stock level is not available as farmers will have some wool on farm, and when wool does reach wool stores there is no official record of total wool held back from sale by farmers, although wool brokers will know stock levels in their stores. This article uses wool sales data to estimate wool stocks and looks at some specific micron categories.
As the introduction intimated, the stock levels shown in this article are estimates only, and do not take into account any wool held on farm or wool sold outside of the auction system. As of the end of March the calculated level of farmer held stocks was estimated to be around 264,000 farm bales, which is equal to 16% of AWTA volumes of the past 12 months.
Wool price levels in 2018 were remarkable in Australian dollar terms, and in US dollar terms a re-run of the 2011 price cycle. It is assumed farmer held stocks reached a minimum around mid-2018 after a run of 2-3 years of high and rising prices. As prices started to trend downwards, farmers started to pass wool in. With prices continuing to trend lower there was little incentive for farmers to sell the passed in wool.
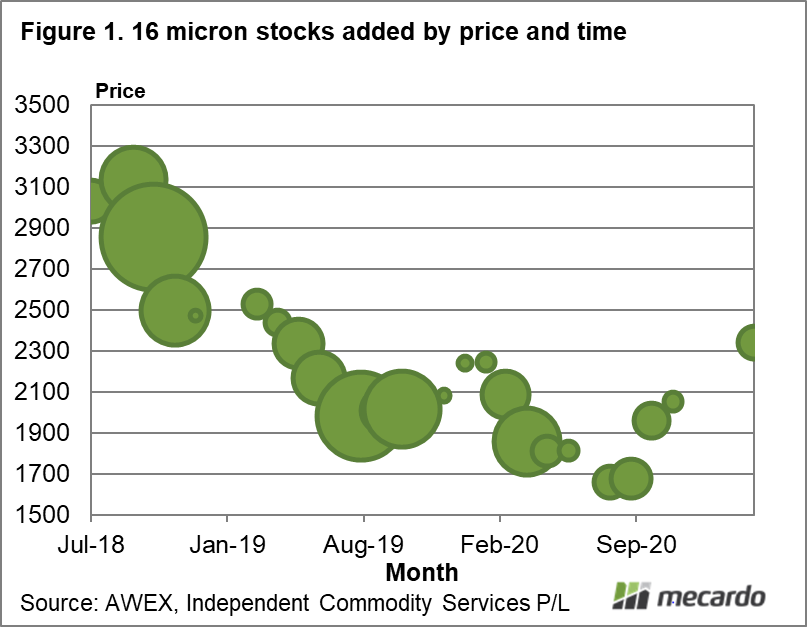
Figure 1 looks at the 16 micron category. It shows the volume (denoted by the size of the circles) estimated to have been added to wool stocks by price level by calendar month, from July 2018 to March 2021. The graphic does not show months where stocks were drawn down. The weighted average price at which 16 micron wool was passed in was 2337 cents, which is the approximate current level of the 16 micron. An alternate way of looking at this is to calculate the proportion of wool passed in at price levels above current prices. For the 16 micron category some 37% of stocks were passed in at higher levels, meaning some 63% of stocks are worth more than when they were passed in.
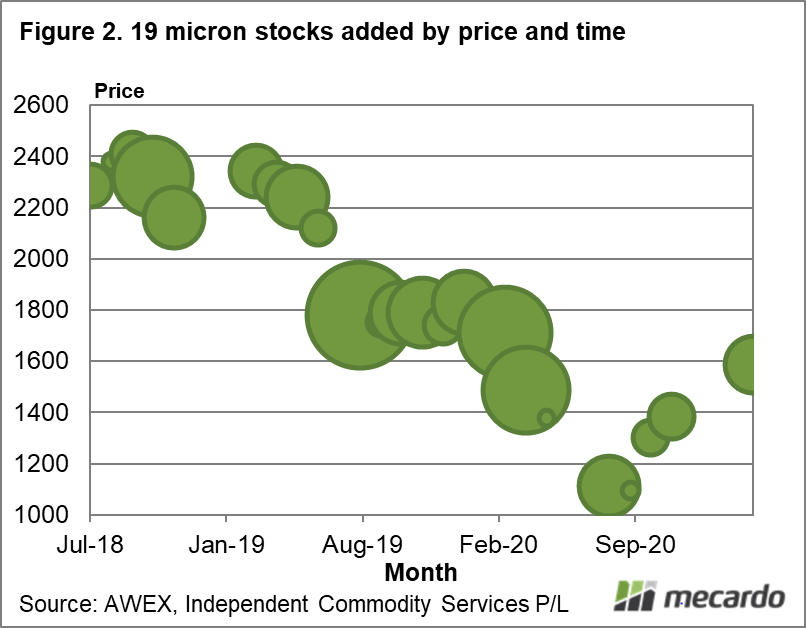
In Figure 2, the exercise is repeated for 19 micron (the big merino category in Australia). It shows a different picture to 16 micron where the average passed in price for 19 micron is 1840 cents, which is 160 cents above current levels. There is some respite for holders of 19 micron stocks as the current price is above passed in levels for the COVID period, from April 2020 onwards.
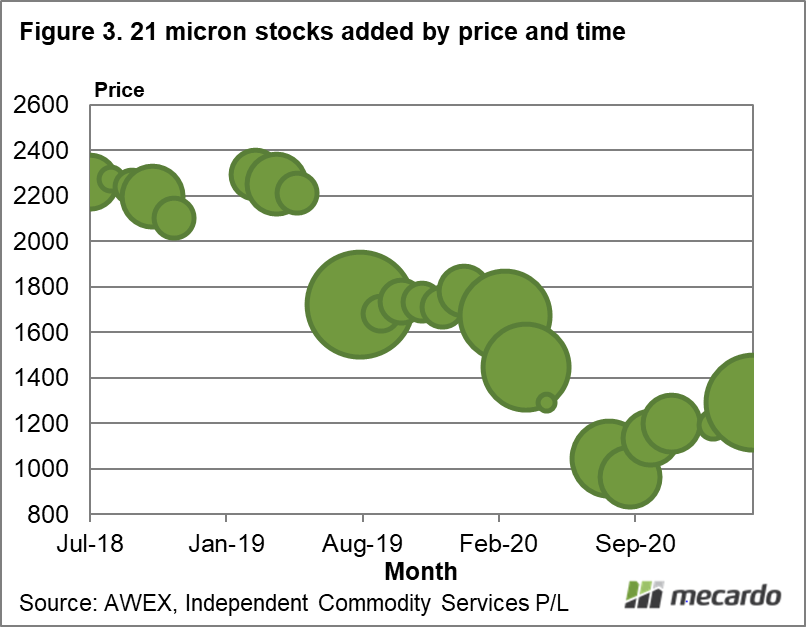
The 21 micron category is analysed in Figure 3. It is clear from this graphic that the passed in price for most stocks is well above the current market. Only a third of the stocks accrued in recent years have increased in value (since May 2020).
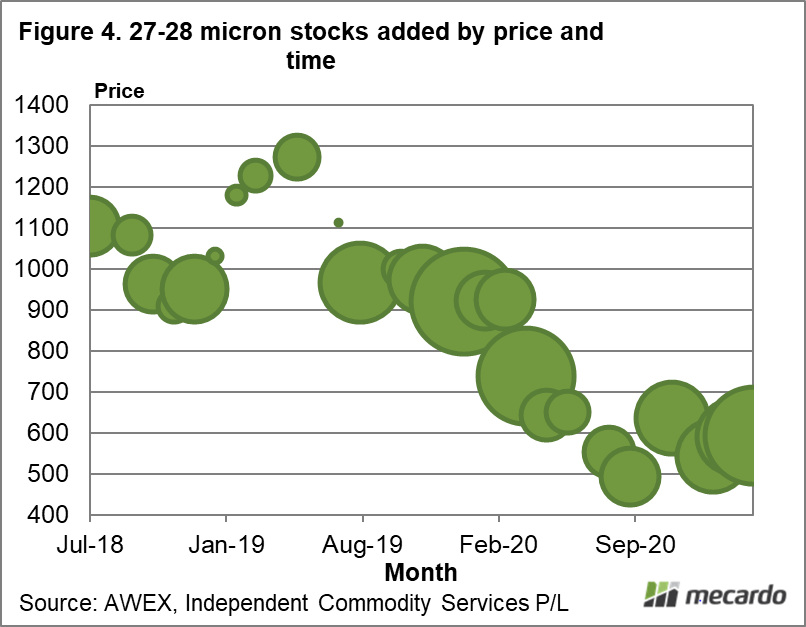
Finally in Figure 4 stock levels for 27-28 micron is analysed. The weakness of this sector of the market means that the average passed in price of 805 cents is some 200 cents above the current price level (27.5 micron).

What does it mean?
The industry has fretted over stock levels held by farmers, harking back to the stock overhang of the 1990s and its depressing effect on the merino market for the best part of a decade. There are some significant differences this time around including strong cashflows from livestock, low wool production (compared to record wool production in 1990) plus wool stock levels are nowhere as high as they were in the 1990s in either absolute or proportional terms. This article shows that stock flows back into the market will be restrained for the time being as price levels are not attractive in relation to passed in values for many categories.
Have any questions or comments?

Key Points
- Nearly two thirds of 16 micron wool stocks are worth more than when they were passed in.
- For the 19 micron category wool passed in from April 2020 onwards is generally “in the money” while wool passed in before mid-2019 is 500—800 cents “out of the money”.
- For 21 micron any stocks accrued before the pandemic effect was felt in the market remain a long way “out of the money” i.e. passed in at price levels well in excess of the current market.
- For crossbred wool, as a general rule passing in wool has not been a successful strategy.
Click on figure to expand
Click on figure to expand
Click on figure to expand
Data sources: AWTA, AWEX, Independent Commodity Services P/L , Mecardo


