After a stellar run from 2011, when the massive cotton price cycle dragged apparel fibres upwards, through to 2019 crossbred wool prices (or more generally non-Merino wool prices) have plummeted. This article takes a long term view of the 30 micron price.
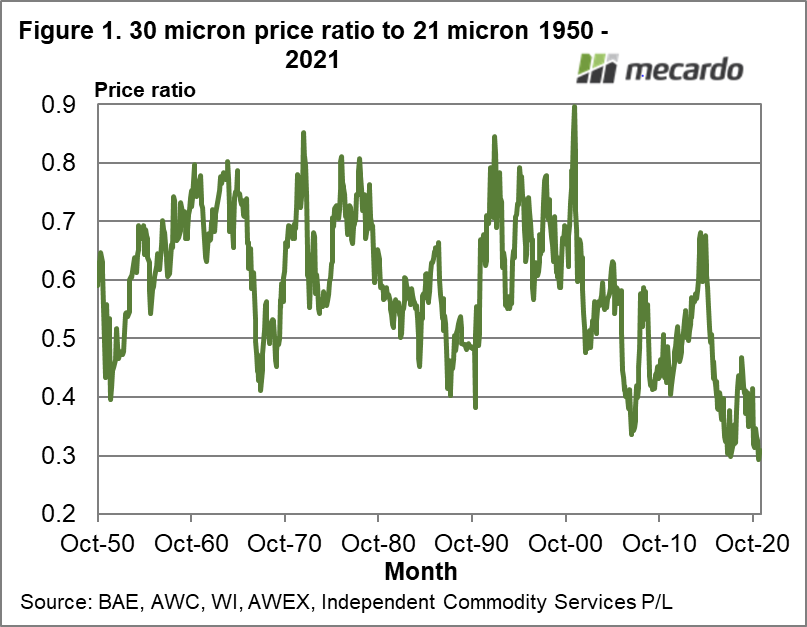
There are several ways to look at price, such as simply in Australian dollar terms, in US dollar terms and in relation to other fibres. Figure 1 shows a long-term series for 30 micron expressed as a proportion of the 21 micron price from 1950 through to the current market on a monthly basis. It clearly shows that the 30 micron price in relation to the Merino (21 micron) price, is trading at very low levels. Historically a ratio of 0.4 has been the low side of this ratio, with the 30 micron trading as high as 0.8.
Crossbreds traded at high levels relative to Merino prices through the 1990s while the Merino prices were depressed with the leftover stockpiles from the 1980s. In recent decades, the supply of Merino wool has trended lower, and in response to this, the price of Merino wool relative to other fibres has risen. Last August Mecardo looked at the price ratio of 21 micron to cotton which is a good illustration of this change in market structure. This helps explain part of the fall in the 30 to 21 micron price ratio of the past two decades.
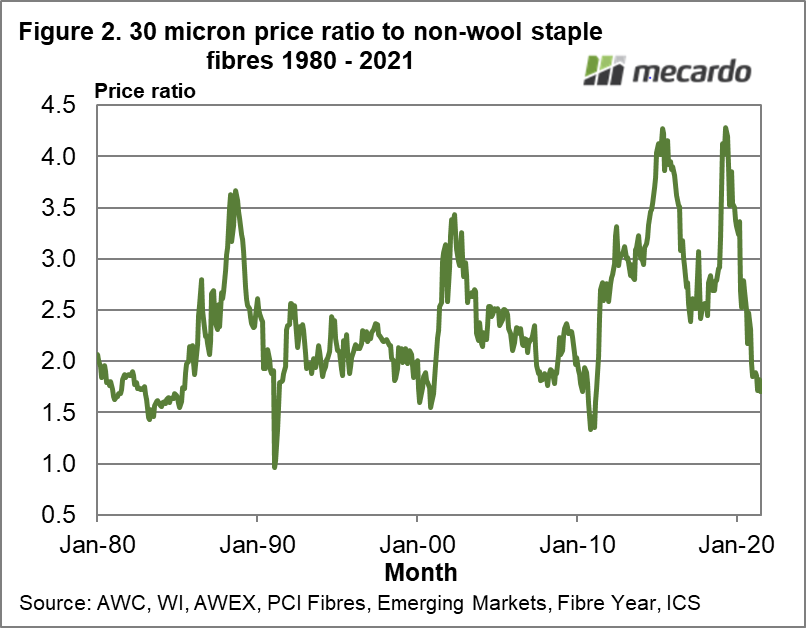
What about non-wool apparel fibre prices? Figure 2 compares the 30 micron price series to a non-wool staple fibre series, made up of cotton, polyester, acrylic and viscose, from 1980 onwards. In this schematic, the big wool markets of the late 1980s, 2002-3 and in recent years stand out with some crossbred characteristics. In periods of low crossbred prices the ratio has tended towards 1.5 (briefly beating that in early 1991 when the market re-started after the collapse of the Reserve Price Scheme in Australia). It is close to this ratio again. What is really disappointing is the high price ratio which the 30 micron price traded in from 2011 to 2020 (2.5 to 4.2) which was well above earlier levels. In early 2020 it had fallen to a relatively high 3.3 (twice its current level) before the pandemic hit and pushed the ratio down to depressed levels. This does raise the hope that when the pandemic is finally overcome, demand may improve and pull the price ratio back up into the range it spent the 2011-2020 period in.
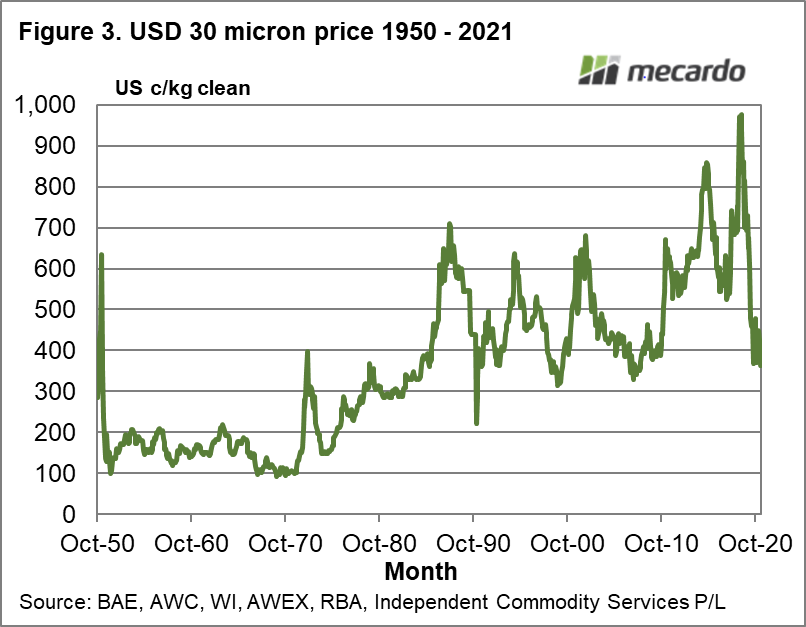
Finally, what does the 30 micron price look like in US dollar terms? Figure 3 shows the 30 micron price in clean US cents per kg terms from 1950 to this month, in nominal terms. A lot has changed during the past 70 years. Price wise the 30 micron has returned to the cyclical low levels of the past two decades, after a stellar run in 2011-2020 period. The hope is that the 30 micron price can recover most of the 43% loss in price suffered as a result of the pandemic in the coming years, taking it back to early 2020 levels, with the first target around US500-550 which is the low level seen in 2012 and 2017.

What does it mean?
A good explanation of the strong performance of crossbred wool prices in the 2011-2019 period would help assess where the market is likely to go from current levels. From the price ratio to non-wool staple fibres and the US dollar price there does not look to be any downside for the 30 micron, with the question then becoming how long until some upside?
Have any questions or comments?

Key Points
- In terms of US dollar price and the ratio to non-wool staple fibre prices the 30 micron price has simply been knocked down to past cyclical lows by the pandemic of the past 18 months.
- The comparison to Merino wool is exacerbated by the Merino price being buoyed by the significant drop on supply in recent decades.
- Crossbred sheep produces have benefited from a similar trend in the falling lamb production outside of Australia.
Click on figure to expand
Click on figure to expand
Click on figure to expand
Data sources: BAE, RBA, AWC, WI, AWEX, PCI Fibres, Emerging Markets, Fibre Year, ICS