With the Merino market relatively steady in recent weeks, this section of the greasy wool market looks to be consolidating the gains made since recovering from cyclical lows made early this season. This article takes a look at what is happening in other apparel fibre and feedstock prices.
The world of apparel fibres is both wide and complex. Various price series for apparel fibres and the feedstocks used to develop these fibres (it is arguable that greasy wool is the feedstock for wool yarn), provide a glimpse at what is going on in other parts of the apparel fibre complex. In this article some of these price series are used to look at the cyclical downturn in the apparel fibre markets since 2018 and how Merino wool prices compare.
In Figure 1 a range of apparel fibre price series are shown from mid-2017 to November 2020, in US dollar terms. US dollar terms are used as we are interested in the underlying price cycle as seen by the demand side of the market. As a schematic, Figure 1 is messy. Apparel fibres operate at different price levels, which make simple comparisons difficult. Prices for non-Merino (non-wool) series are shown on the left-hand axis and for merino on the right-hand axis. Through the “messiness” many of the price series peaked in 2018 and then trended lower through to mid-2020, before picking up in recent months, which is the pattern the Merino price has followed.
To allow comparison of the various apparel fibre price series, each series in Figure 2 has been converted to an index based on the average price for the 2017-2018 season. This puts all series on the same scale. The downturn in price from mid-2018 to mid-2020 becomes a lot clearer. It is a good illustration of how apparel fibre prices track together, unless there is some peculiarity pushing a fibre price out on its own which is usually a relatively temporary aberration.
In Figure 2 the Merino price bottomed out last among the series shown, but has bounced in recent months in line with most fibres. The stand out fibre has been cotton, which is only 10% down on its 2017-18 price level despite massive stocks.
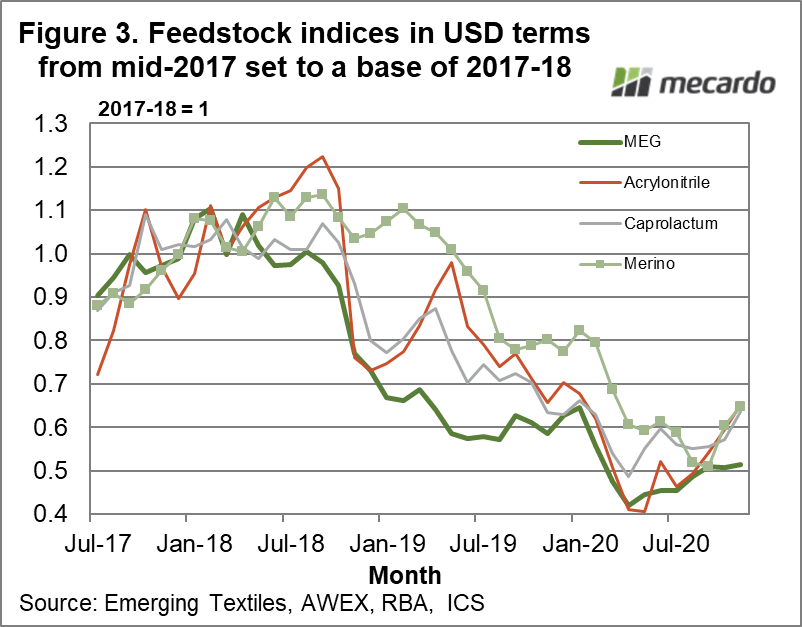
In Figure 3 Merino is compared to the price indices for manmade fibre feedstocks. It is a similar story to Figure 2, although in this case Merino matches the best performing feedstocks indices.
Interestingly, the effect of COVID-19 shows up only as the last downward leg of the 2018-2020 down cycle for apparel fibre and feedstock prices.
What does it mean?
The wool industry does have a propensity to spend too much time talking about marketing and its purported effect on demand. Merino prices in general will track the price cycles and trends of the apparel fibre complex as they have during the past two years. Merino production is low, as are supply chain stocks levels. Farmers stocks have built up during the past two years, which will help the industry for the next 2-3 years during the recovery phase from COVID-19.
Have any questions or comments?
Key Points
- The Merino price has followed the general pattern of apparel feedstock and fibre prices since mid-2018.
- With the exception of cotton, the merino price is performing creditably compared to the other apparel feedstock and fibre prices.
- Low merino wool supply and stock levels through the supply chain will help the merino price in relation to the general apparel fibre complex in the coming couple of years.
Click on figure to expand
Click on figure to expand
Click on figure to expand
Data sources: Emerging Textiles, Cotlook, RBA, AWEX, ICS, Mecardo.


