The price performance of various wool categories ranges widely at present. This article takes a look at the performance of different wool categories and how they stack up against other apparel fibres.
It is always a challenge to compare different apparel fibre prices when they run from hundreds of dollars per kg (cashmere) to a couple of dollars per kg (polyester staple and broad crossbred wool). In addition the floating Australian dollar can distort prices, such as in 1999-2001 when the strong US dollar turned a standard strong cycle of fine wool premiums into an absolute boom cycle in Australia and New Zealand. To address these issues prices are looked at in US dollar terms in this article, as we want to see the markets as the supply chain does, and price levels are looked at in terms of five year rolling percentiles and also their change in price level since the (southern) spring of 2017.
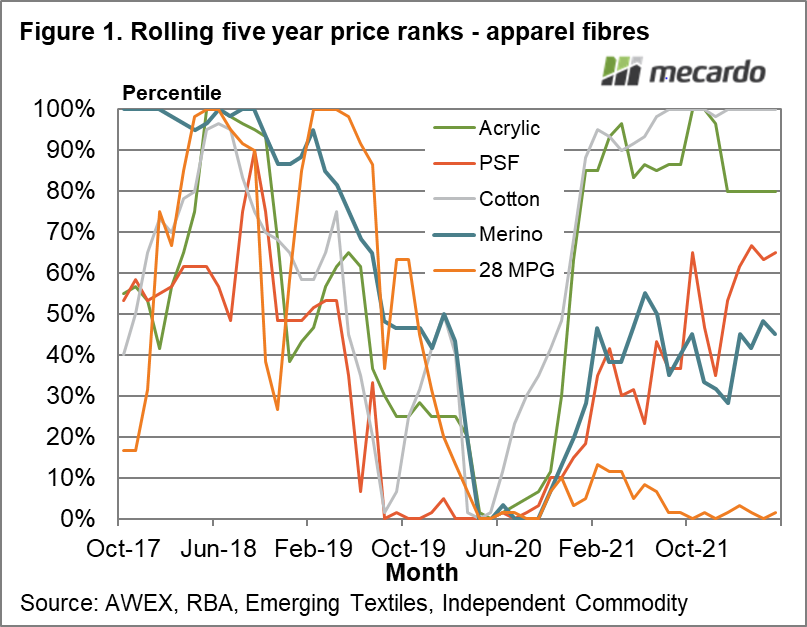
Figure 1 shows the rolling five year percentiles for a range of apparel fibres from spring 2017 through to this month. Cotton leads the way as the article last week showed, with acrylic coming second. In the middle percentiles are polyester staple fibre and merino (the average merino fibre diameter which is 18.5 to 19 micron) with the 28 MPG having the lowest ranking as it has done since late 2019. There is no real change in the ranking since Mecardo last published an article on apparel fibres in early April.
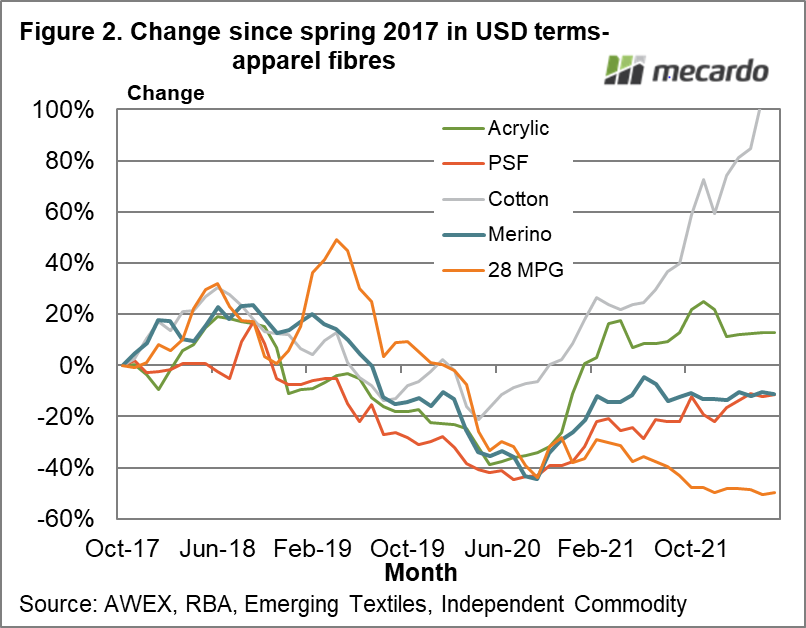
In Figure 2 the change in price from the (southern) spring of 2017, for the same apparel fibres as shown in Figure 1, is shown. While this analysis is sensitive to the relative starting points for the different apparel fibres it illustrates the downtrend in apparel fibre prices which was in place from late 2018 through 2019, and then the extended effect of the pandemic leading to low prices generally in mid-2020, from which the apparel fibres have recovered to varying degrees with the key exception of the 28 MPG.
The rank of performance in Figure 2 matches that of Figure 1 but the outperformance of cotton is clearly shown. Acrylic, polyester staple and merino wool are all within 20% of their late 2017 price levels in US dollar terms. Cotton, in comparison, is double its’ late 2017 price and the 28 MPG is half.
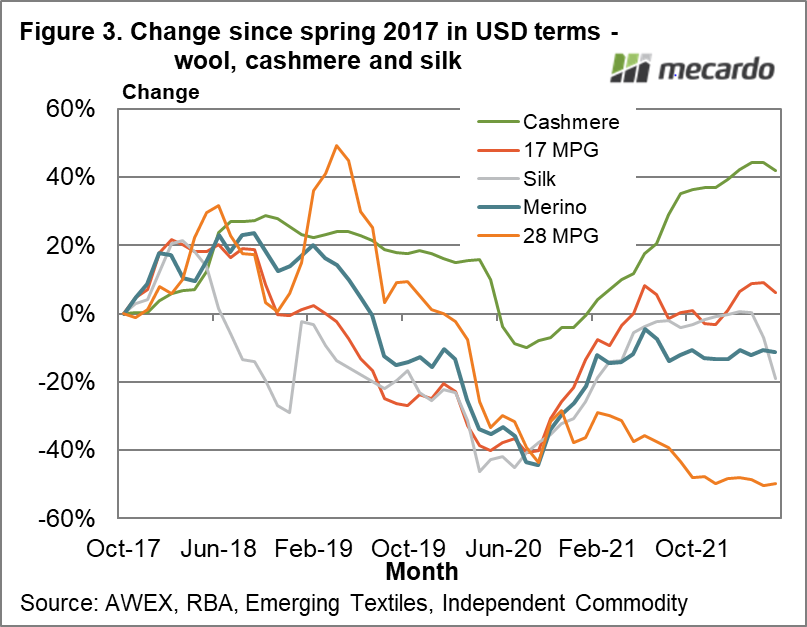
Figure 3 repeats the analysis of Figure 2 but focusses on smaller volume, natural fibres. In this format cashmere is the best performer, up 40% on late 2017 levels with the 17 MPG, silk and merino within 20% of late 2017 prices.

What does it mean?
At this point in time the apparel fibre background to the merino market is on the whole a neutral one, assuming that cotton cannot keep trending higher indefinitely. The solid cashmere price is good as it points to fine merino being somewhere around fair value.
Have any questions or comments?
Key Points
- Apparel fibre prices have not changed greatly in recent months, except that cotton has strengthened further.
- Overall the apparel fibre background to wool looks to be neutral to positive.
- Most fibre prices are without trend (neutral background) except cotton which has been trending higher (positive).
Click on figure to expand
Click on figure to expand
Click on figure to expand
Data sources:
AWEX, RBA, Emerging Textiles, ICS
