
Greasy wool is embedded within an old and complex matrix of related fibre markets. Any assessment of wool prices needs to take into account the wider apparel fibre backdrop. This article looks at a couple of views of the current apparel fibre complex.
The cycles and trends seen on the wider apparel fibre markets are usually the paths taken by wool prices, unless there is a particular factor pushing wool prices onto a separate path such as the collapse of a reserve prices scheme some thirty years ago to this week.
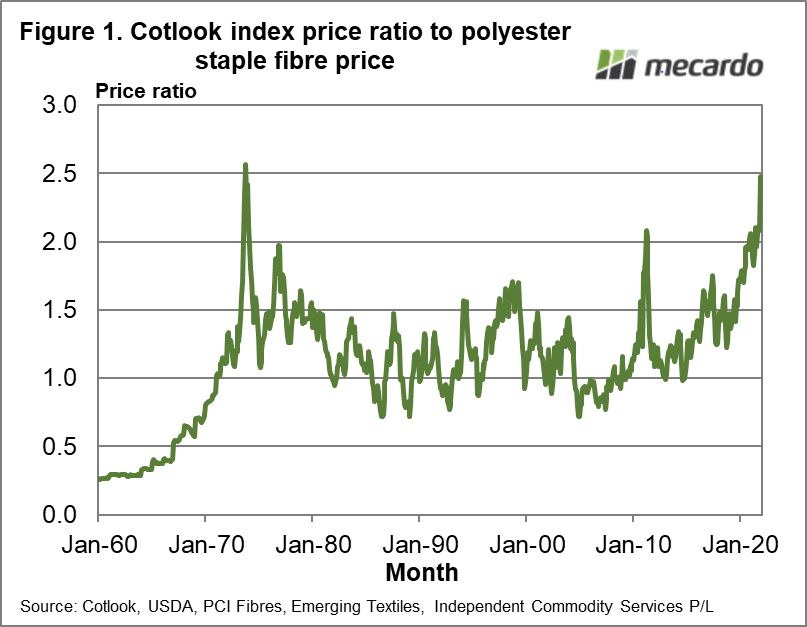
In the current apparel market cotton is trading at sky high levels in relation to polyester staple fibre (PSF). Figure 1 shows the price ratio of the Cotlook Index to a PSF price series from 1960 through to the end of 2021. The ratio rises quickly in the 1960s because the price of PSF (and manmade fibres generally) was falling quickly as the increased production of these fibres allowed the cost of production to be driven downwards. In late 1973 the ratio peaked at a little over 2.5, a level not reached again although the current market is within cooee. After the mid-1970s the cotton to PSF ratio ranged roughly between 0.72 and 1.7, cracking the 2 level briefly in 2011 when cotton prices rose to price levels not seen since the American Civil War. In the recovery from the COVID-19 pandemic induced lows of 2020, the ratio reached 2 again in late 2020 and has since lifted to be close to 2.5. Cotton is expensive in relation to polyester staple fibre.
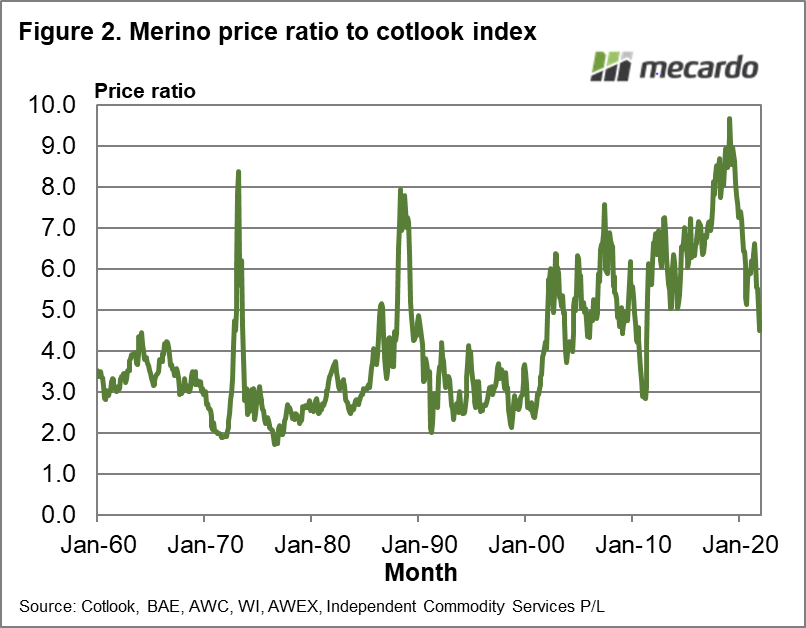
Figure 2 shows the price ratio for the average merino micron price to the Cotlook Index from 1960 through to the end of 2020. March 1973 and the June quarter of 1988 stand out as periods of very high price ratios. In the 1980s the rule of thumb for a sustainable wool price was a ratio of three times synthetic prices (with a similar ratio to cotton). The floor price set in 1989 was pitched at a ratio between 5 and 7 which helps explain the thirty-first anniversary we are celebrating this month. From 1990 onwards the quality of the Australian merino clip changed with the average fibre diameter trending lower, which when combined with lower production helps explain the rise in the merino to cotton price ratio, once the stockpile left over from the Reserve Price Scheme was finally liquidated in 2001.
The strong price cycle of 2018 saw the merino to cotton price ratio reach 9, with the subsequent down cycle in apparel fibre prices taking the ratio back down to a more sustainable 7 by early 2020. Enter COVID-19, which pushed the ratio down to around 5 before recovering somewhat by mid-2021. At this point the cotton price begins its strong rise (as seen in Figure 1) which has pushed the merino cotton ratio down to a low 4.5.

What does it mean?
Merino wool is cheap in relation to cotton and cotton is very expensive in relation to polyester staple fibre, by historical standards. 31 years on from the collapse of the Reserve Price Scheme the merino clip has changed markedly in terms of quality (finer) and size (smaller) to the point where price ratio of 5 to cotton is viewed as low, with a ratio around 7 as the more justified by the volume and quality of the merino clip.
Have any questions or comments?

Key Points
- Cotton prices are trading near record levels in relation to polyester staple fibre prices
- The merino price is trading at a relatively low ratio to cotton given the supply and fibre diameter of the merino clip
Click on figure to expand
Click on figure to expand
Data sources:
Cotlook, USDA, PCI Fibres, Emerging Textiles, BAE, AWC, WI, AWEX, RBA, Bob Richardson, ICS


