Apparel fibres tend to trend and cycle in unison, unless some particular factor pushes a fibre onto a different path. With this framework of apparel fibre prices in mind, this article takes a look at the apparel fibre complex background to greasy wool prices.
In the 1960s as the price of the new emerging manmade fibres fell quickly as a result of improved efficiencies in production processes there was strong downward pressure on wool prices. In the 1980s the rule of thumb for a sustainable greasy wool price in Australia (before fibre diameter began to increase markedly in value) compared to synthetic was 3:1. The point of this limited, potted history is to shown that a strong relationship between wool and other fibre prices is long and well established. By rights any analysis of wool prices, for example when discussing the pros and cons of wool marketing, should take this into account. Bob Richardson’s wool research paper, ‘The politics and economics of wool marketing’ cited the example of where this was ignored when the floor price in the late 1980s was set at levels between 5:1 and 7:1 to synthetic price ratios.
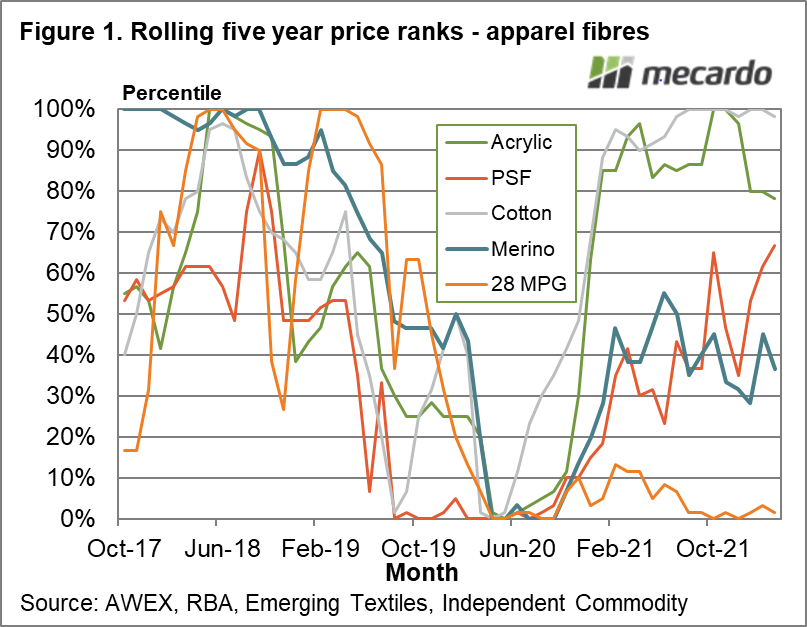
Figure 1 shows the rolling five year percentiles for a range of apparel fibres, beginning in 2017 and running to March 2022 using US dollar prices. All fibre prices shown dipped to five-year lows in mid-2020 in response to the initial effect of the covid pandemic. With the exception of cross bred wool (represented here by the 28 MPG) all fibre prices (and consequently price ranks) lifted in late 2020, into 2021. Some rose more strongly with cotton leading the way with acrylic a close second. Polyester staple fibre (PSF) and merino (roughly 18.5-19 micron) had a more modest recovery by this measure.
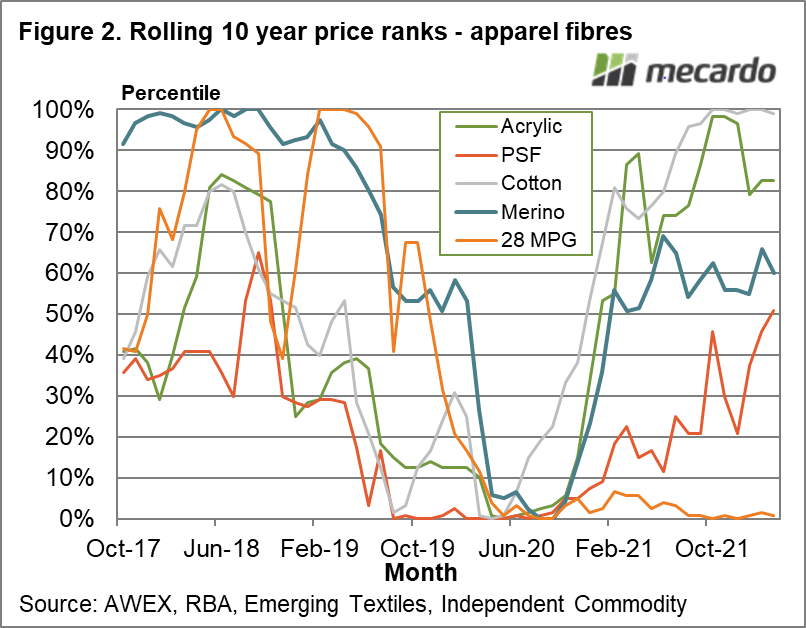
The exercise is repeated in Figure 2, using rolling ten year price percentiles this time. The overall picture is similar although the merino recovery improves, with the ten year price currently around its 60th percentile. The Polyester Staple Fibre (PSF) rank has picked up recently on the back of stronger energy prices. Overall the apparel fibre background to merino wool is a positive one. Merino wool is not overvalued by the standards of apparel fibre price ranks.
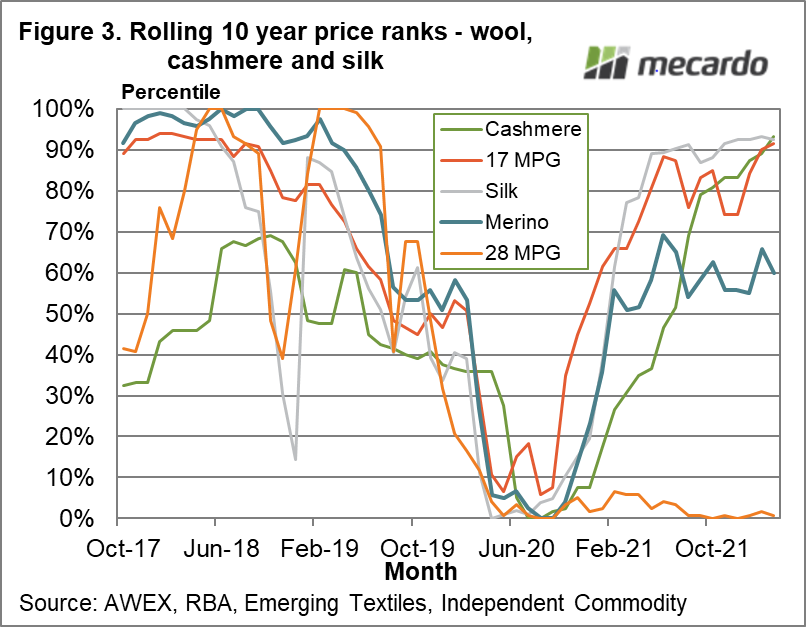
Next, we’ve compared greasy wool prices to a couple of the noble fibres. Figure 3 compares the rolling ten year price ranks for merino (18.5-19 micron), the 17 MPG, the 28 MPG, cashmere and silk. The schematic shows that fine merino wool, silk and cashmere are all running around their 90th percentile level for the past decade (in US dollar terms), which is to say they have strong prices. Crossbreds are the outlier, with depressed prices.

What does it mean?
Apparel
fibre price levels remain supportive of current merino prices, with the finer
merino prices performing very well and are on par in percentile terms with
cashmere and silk. Crossbred prices remain an outlier in their depressed state.
Have any questions or comments?
Key Points
- Apparel fibre prices (with the striking exception of crossbred wool) staged strong recoveries from the lows of mid-2020 through to mid-2021.
- Cotton has been the strongest performer continuing to push up to new highs since mid-2021. This is even more impressive give the huge size of the cotton market.
- 17 micron has matched the performance of cashmere and silk, all currently trading near their 10 year 90th
Click on figure to expand
Click on figure to expand
Click on figure to expand
Data sources: ICS, Mecardo
