
Last month Mecardo looked at ABARES data which provided a profile of the Australian sheep flock, broken into four size categories. In this article ABARES data for sheep farms is used to calculate a more detailed profile of the Australian wool clip.
ABARES provides a breakup of farm performance by size (into deciles) for a range of industries (view data here). Using the wool receipt data for sheep farms (11431 farms, which is a subset of all the farms with sheep), kindly provided by ABARES, the volume of wool was calculated using the average price for wool sold at auction (1686 cents per clean kg) during the three seasons to 2019-20, using the 113 clean kg average bale weight for the three seasons.
The attraction of using this data, in comparison to the earlier flock profile data (view Jan ’22 article) which covered a much greater part of the Australian flock, is the detail of the profile; 10 categories (deciles) as opposed to four categories.
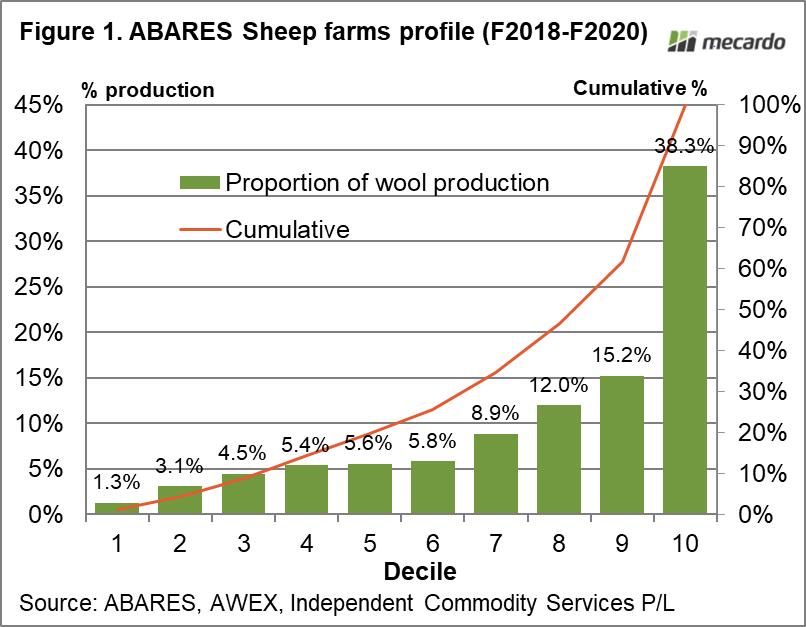
Figure 1 shows the calculated decile profile of wool production for sheep farms in the three seasons to 2019-20. As the earlier flock profile showed there is a long tail of smaller clips with the bottom half of clips accounting for only 20% of production. The bottom 70% of the clip accounts for 34.5% of production, which is close to the 36% calculated using the flock data. In comparison the top decile accounts for 38% of production, very close to the 37% calculated using the flock data. In this analysis the top 3 deciles (30 of clips) account for two thirds of wool production.
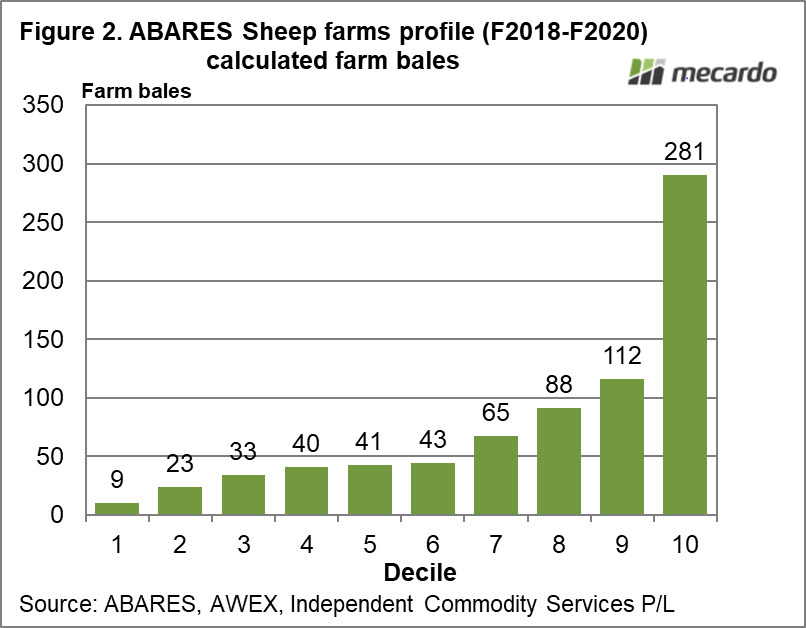
Figure 2 shows what this means in terms of wool clips in farm bales. The same deciles are shown as in Figure 1, along with the calculated average clip size for each decile. In this analysis the median clip size is 41 farm bales, with the average clip size a much larger 76 farm bales. This is a larger average than the 61 bales calculated using the flock data, so at this stage the estimated average clip is between 60 and 80 farm bales.
The analysis shows the Pareto principle is alive and well in the distribution of sheep flock and wool clip sizes in Australia, with the ratio more 70:30 than 80:20. Details of the breed distribution across the profile would be useful, as well as a geographic dimension. That would take a larger survey, which ABARES is probably not going to do but it is a thought for the sheep and wool industry, perhaps at 3-5 year intervals. It would be nice to actually know how the industry is structured.

What does it mean?
The ABARES sheep survey data lines up well with the larger flock survey data in terms of production profile, with the top 30% of clips accounting for two thirds of production. A lack of breed data across the profile is something of a problem in terms of accurately understanding the profile of the wool clip. An understanding the profile of the sheep flock and wool clip allows services and extension to be better targeted to the industry and perhaps to allow improved research and development.
Have any questions or comments?

Key Points
- The ABARES sheep industry survey data shows the top 30% of farms account for two thirds of wool production.
- The bottom half of farms in terms of size account for about 20% of wool production.
- The median size clip is around 41 farm bales, with the average size wool clip between 60 and 80 farm bales.
Click on figure to expand
Click on figure to expand
Data sources: ABARES, AWEX, ICS, Mecardo


