Many readers will remember filling out the Australian Bureau of Statistics (ABS) Agricultural Commodities survey last July, and might be wondering what happened to the data. Well, it was released at the end of May, and we’ve seen the headline flock number, but breaking it down makes for some interesting reading.
There is more data revealed in the ABS Agricultural Commodities Report than we can discuss in one article, so we’ll start with the big numbers.
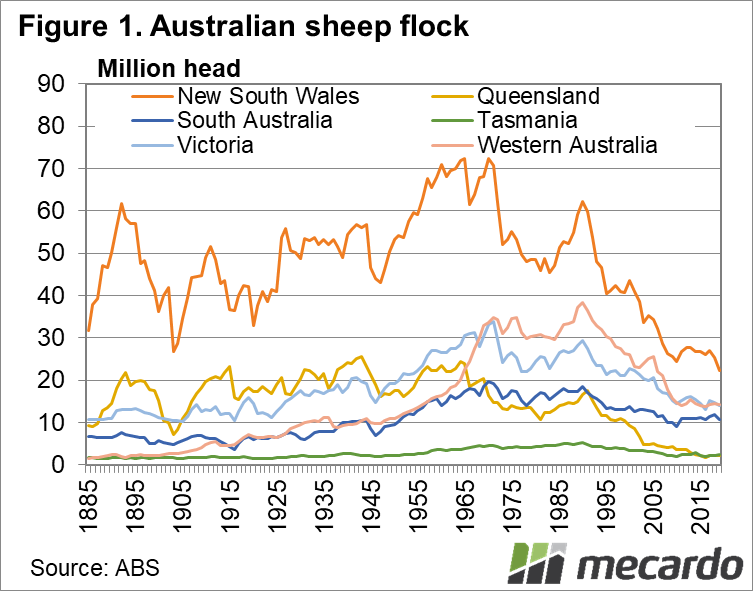
We know the Australian sheep flock is at an over 100 year low, but in NSW June 2019 marked the lowest sheep flock for the state on record. Figure 1 shows the NSW flock fell 11% from June 2018, but it remains the biggest sheep state, accounting for 34% of the National flock. In 20 years the NSW flock has almost halved.
South Australia also had a heavy fall, losing 10% of their flock, with Victoria down 5%. WA managed to largely maintain their flock, down just 1%, but it has still halved since 1995.
With NSW bearing the brunt of the drought and SA also being heavily impacted, it should be no surprise that those two states saw the biggest downturn.
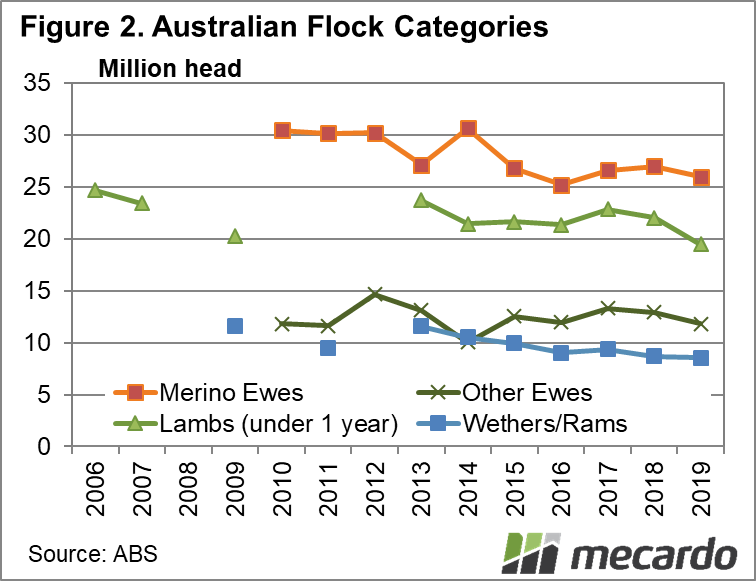
Despite the total flock being at its lowest level since 1905, the breeding ewe flock at the 30 June 19 was still marginally above 2016 (Figure 2). The flock fell 7%, breeding ewes were down 4.7%, and lambs under 1 year were down 11.6%. Strong wool prices helped save some wethers, with the rams and wether portion of the flock down just 2%.
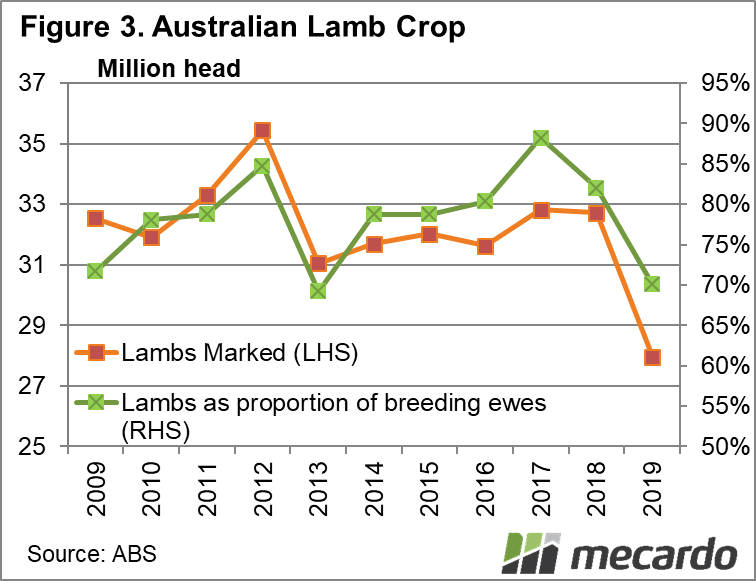
The lamb portion of the flock was down due to a smaller lamb crop in 2018-19. In fact, the lamb crop was at its lowest level since our records start in 2009 (Figure 3). The green line shows lambs marked as a proportion of breeding ewes on hand as at June 30 the previous year. Low lamb marking in 2018-19 shows the worst reproductive performance in six years.
We can see that from 2016 the flock bounced back, with the lamb crop coming in at 88% of the ewe flock. While the ewe flock is likely to be lower this year, the lamb crop and flock numbers can recover from lows with a good season.
What does it mean?
The ABS data clearly shows how the season can impact lamb supply and flock change. From this, we can extrapolate that 2019-20 likely had a small lamb crop and that the ewe flock will have eased further. We also know that with the better season currently being experienced, we could see the lamb crop bounce back to 30 million head in 2020-21 or possibly even higher.
Have any questions or comments?
Key Points
- The ABS Commodities survey data for 2018-19 was released late in May, confirming a new low for the flock.
- NSW had the biggest decline in sheep numbers, while on a National scale it was lambs on hand which were down the most.
- Breeding ewe numbers did not hit a new low, meaning the lamb crop could recover quickly.
Click on graph to expand
Click on graph to expand
Click on graph to expand
Data sources: MLA, Mecardo


