After the early year rally, the young cattle market has shown some signs of weakness. It shouldn’t be surprising, we know how far in front of the international market the Eastern Young Cattle Indicator (EYCI) is. Here we look at historical early year trends, and look to see if it gives us a template for the rest of the year.
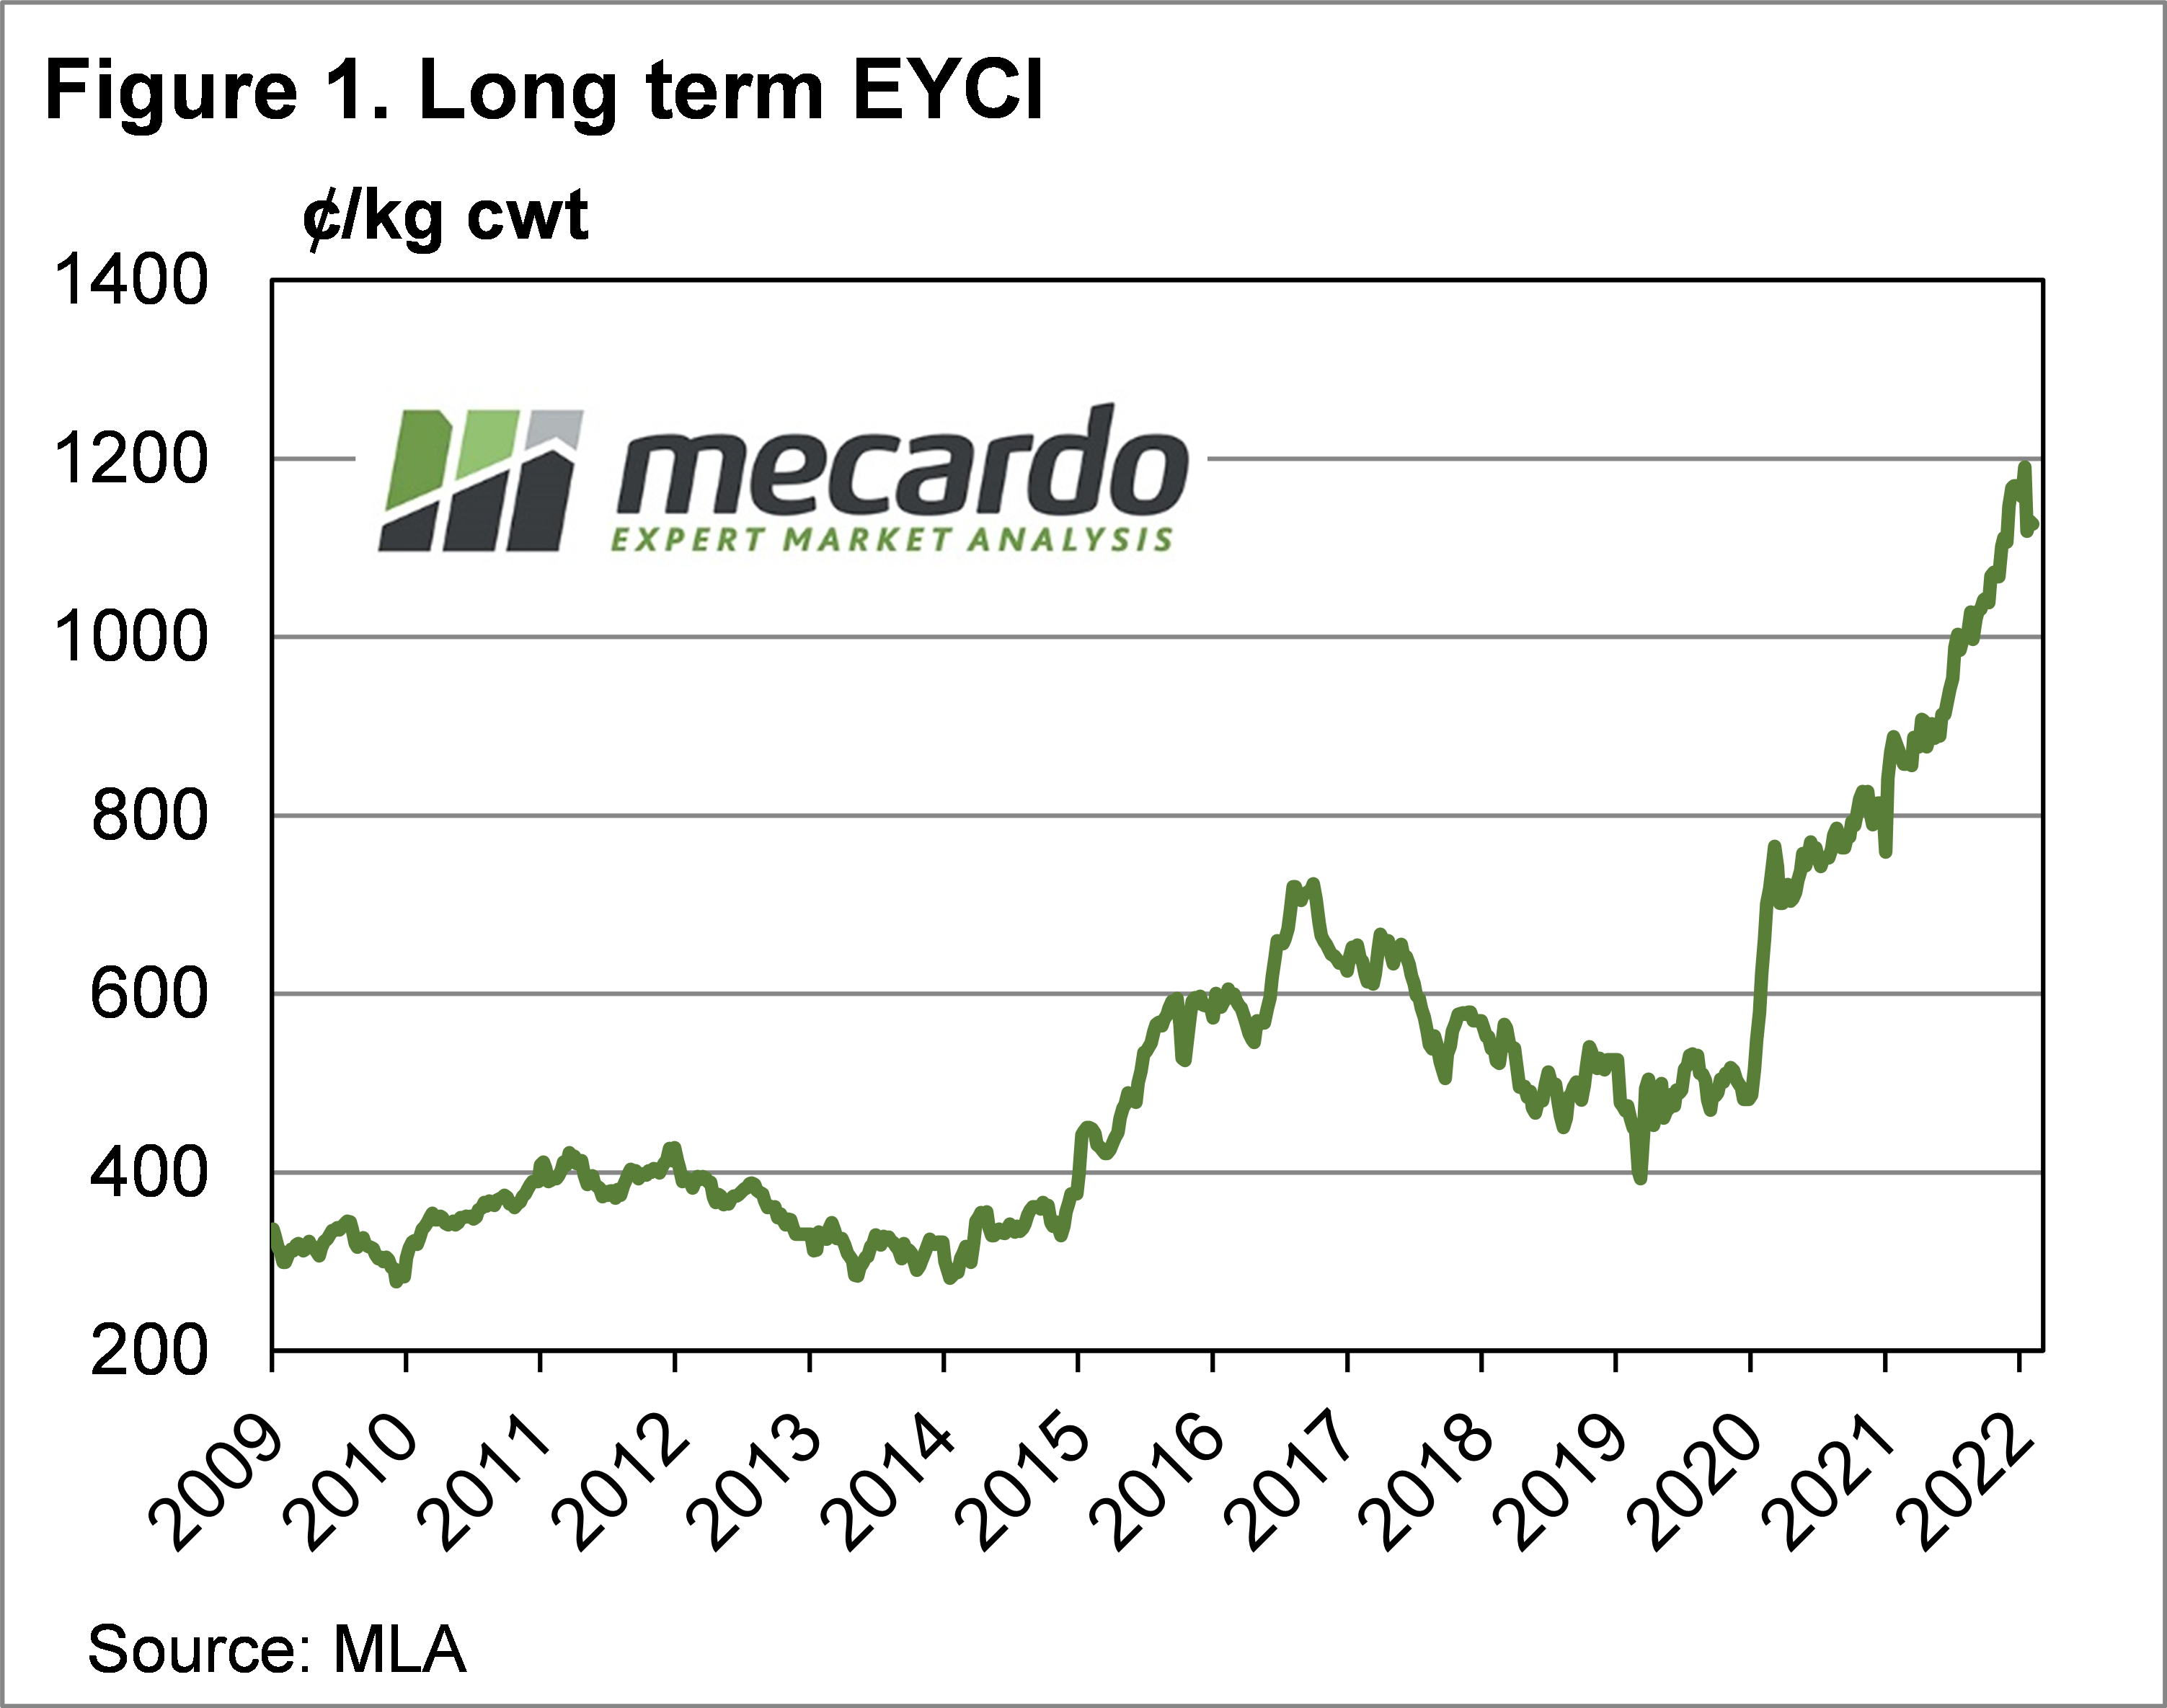
The EYCI is the main indicator of young cattle prices, it covers the most cattle and area of all cattle indicators. Figure 1 shows that the last three weeks has seen the EYCI have its largest fall since the upward trend started in January 2020.
Technically, the EYCI is not in a downtrend yet, but the top is looking a lot like a head, which when the market falls, is followed by shoulders and a continued downward trend.
There has long been a theory around that early year moves give an indication of where the EYCI is headed for the rest of the year. Over the last 13 years this has, in general, been true. Figure 2 shows that over the last 13 years the direction of the January to February price movement has matched the movement from February to December 9 times.
There have been 3 years, 2011, 2014 and 2019 when the price fell early in the year, but finished higher. In 2018 the EYCI was steady from February to December after an early fall. Since 2009 we have only seen the EYCI finish the year higher than it started, after an early fall, in 2014.
Of main concern will be the years of 2012 and 2017. In those years the EYCI started with a small decline, which grew to 15 and 11% respectively from February to December. Both were after a period of strong increases or sustained peaks.
Both those previous strong price declines were also followed by another year of price falls, but they were small in comparison.

What does it mean?
Last week’s article looked at the EYCI premium to the 90CL Frozen Cow indicator, and came to the conclusion that if supply is going to rise as expected, the EYCI will have to fall. The question is when. The best-case scenario for prices this year appears to be steady, but the worst case isn’t disastrous.
A 15% price decline from here would still have the EYCI at 957¢, a level undreamed of a year and a half ago. A fall of this magnitude would be terrible for those trading expensive cattle, but for those producing calves business will still be very good.
Have any questions or comments?
Key Points
- The EYCI has fallen early in 2022, and early moves historically set the trend for the year.
- The best-case price scenario looks to be steady prices for 2022, but a fall is more likely.
- A fall of 15% would leave calf producers still very profitable, but provide pain for traders.
Click on figure to expand

Click on figure to expand
Data sources: MLA, Mecardo
