
With improved seasonal conditions come higher vegetable fault levels, as Mecardo assessed in January. This article takes a further look at vegetable fault in the Australian clip in relation to rainfall and then looks at discounts for higher VM medium Merino pieces.
Most vegetable fault (VM) comes out of eastern Australia, more specifically the northern and pastoral regions in eastern Australia. When the Newcastle selling centre operated, it offered not only the finest Merino wool but also the highest VM wool of any centre. Given this regional supply, eastern rainfall is used to model the supply of VM.
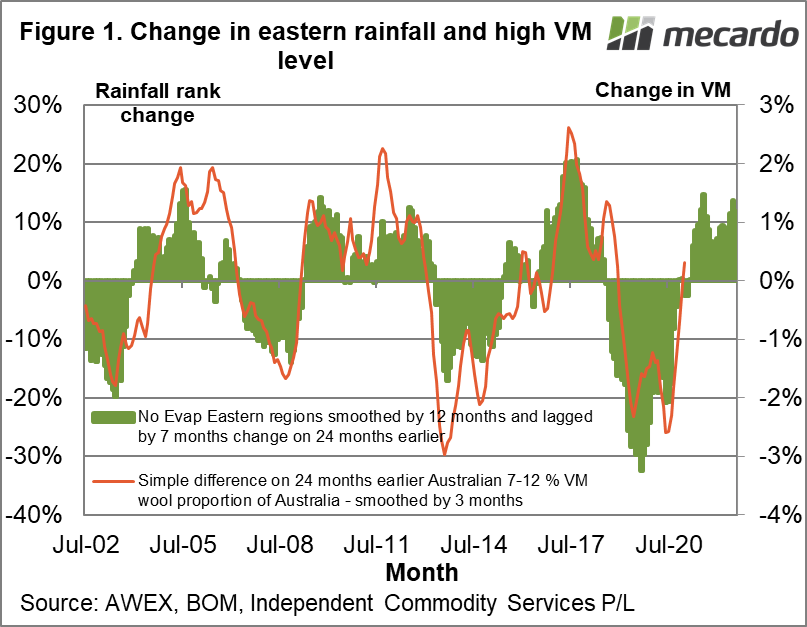
In Figure 1 the change in the rainfall rank in eastern (South Australia and east from there) wool growing regions is compared to the proportion of 7-12% VM wool in the clip. As our recent article showed (view here) most wool produced in Australia has a relatively low vegetable matter fault with some 76-79% of wool in the Australian clip having a VM level of 2% or less (clean basis). The 7-12% VM category is used as a marker in the clip, even though it only accounts for 2-6% of the clip volume. The distribution of VM is not a normal bell curve shape, but more like a power distribution which is not easily described in mathematical terms.
It is no surprise that the rainfall based model projects that the proportion of high VM wool is likely to keep rising through to the spring. In Figure 1 the rainfall data used is rolling 12 month rainfall rank, weighted across wool production regions which is smoothed by months with the 24 month change taken (not a normal 12 month change) which is finally lagged by seven months. This gives a good idea of the likely change in the proportion of high VM wool.
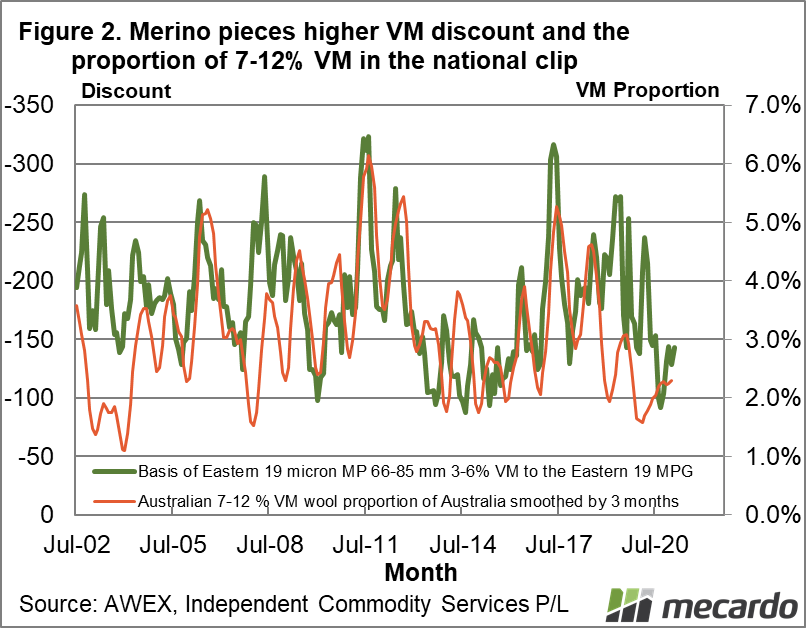
The logical question which follows is what effect change in supply will have on price, or really the discount for vegetable fault in the wool. Figure 2 is a part answer to this question. It shows the proportion of wool with a VM level of 7-12% (right hand scale) compared to the clean cents per kg discount for 19 micron Merino pieces with a VM level of 3-6% to the 19 MPG (left hand scale inverted). The correlation between the two series varies, from quite tight to quite loose, which is why it is only a part answer.
The discount for 19 micron Merino pieces with 3-6% VM is still relatively low (although this is not necessarily the case if the wool has cott and other faults in addition to the VM level) which matches up with the relatively low proportion of 7-12% VM wool. By August there is a good chance the proportion of 7-12% VM in the clip will be in the 4-6% range and this is likely to cause the discounts for the Merino pieces to increase by 100-150 cents (clean basis).

What does it mean?
Discounts for medium Merino pieces have been small as they have for finer Merino pieces, reflecting the stronger knitwear demand in relation to worsted wool (think suits) demand. Further increases in VM levels will increase the processing cost for wool where VM levels are increasing, which means the discounts or difference in price between the higher VM wool and the lower VM wool (which the AWEX MPGs reflect) will widen for the next six to seven months.
Have any questions or comments?

Key Points
- A rainfall based model backs up the view that VM levels are likely to increase through to the coming spring.
- There is plenty of scope for the proportion of high VM wool in the clip to rise in line with the normal seasonal pattern.
- For medium Merino pieces there appears to further scope for discounts to widen by 100-150 cents between now and the spring.
Click to expand
Click to expand
Data sources: BOM, AWEX, Independent Commodity Services P/L


