With articles in the press about growers holding greasy stock for the medium term and brokers fielding enquiries from farmers about buying greasy wool, it is timely to look at the time it takes for wool prices to recover part of the previous down cycles. This builds on the article from earlier this week.
Firstly, the caveats. While the average dimensions of price cycles (in terms of time and price movement) are of interest, there is quite a deal of variation between them. A second caveat to this analysis is that it is underpinned on knowing when the turning points in the market are (highs and lows) which are not necessarily clearly understood until well after the event, with the advantage of hindsight.
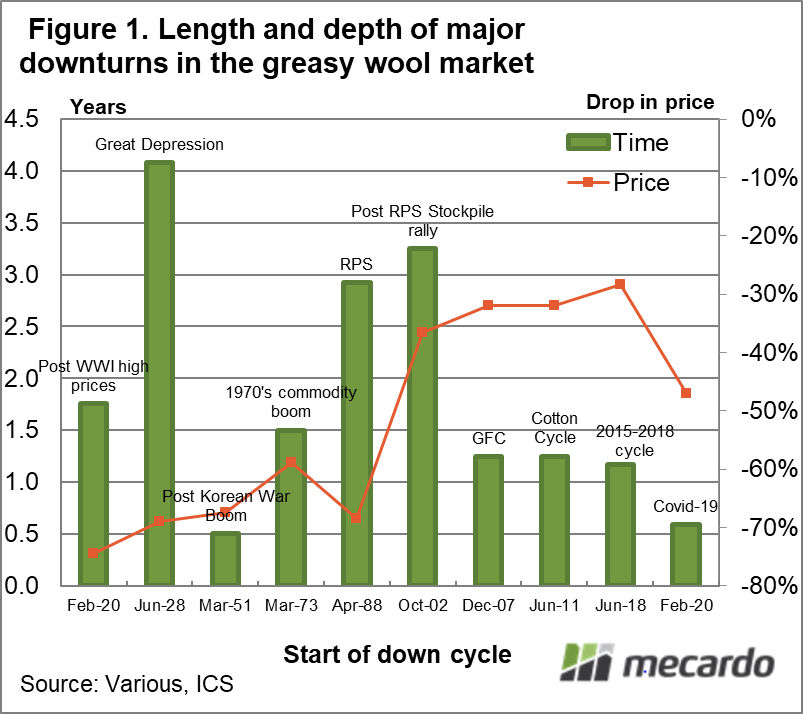
Figure 1 is a summary of the major down cycles shown in the article from earlier this week. The schematic shows the length of time in years in bars (left hand axis) which the down cycles took, and the line shows the size of the price fall (right hand axis). Down cycles from the past century are included, with the current downturn broken into two parts – the first running from mid-2018 to early 2020 and the second from early 2020 to now (the COVID-19 downturn).
The downturn which finished in the early 1930s was the longest run down cycle of 4 years length. The down cycles due to the collapse of the Reserve Price Scheme and the down cycle after the 2002-3 pots stockpile boom, both ran for three years. In recent cycles the downward leg has lasted for around 1.25 years (15 months). The current COVID-19 down cycle has only been running for seven months (about on par with the quick retracement in prices after the Korean War peak in early 1951. At this stage everyone is uncertain about how long this COVID-19 downturn will run for.
For arguments sake, let us assume the down cycle runs for 12 months or so, finishing in the autumn of 2021. That does not necessarily mean prices keeping falling at recent rates. In this scenario it means a recovery in demand, which can start to pull prices higher, does not start until the autumn of 2021. What sort of timeframe can be expected for prices to recover half of the recent fall?
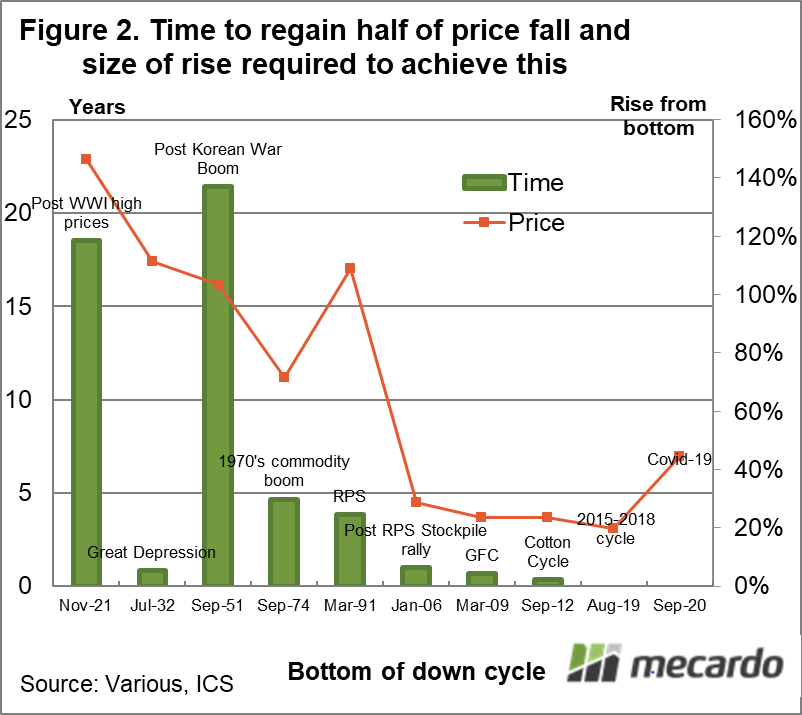
Figure 2 looks at the down cycles of the past century and shows the time taken (in years on the left hand axis) to recover half of the price fall. It also shows the recovery of half of the price fall as a percentage of the cyclical low price (right hand axis). Recent cycles (prior to 2018) have taken a year or less to regain half of the fall, with price rising by 25-30% from the cyclical low. In the current COVID-19 downturn price would lift by 44% to regain half of the fall since February 2020. Note that in the great depression it took only a year for prices to regain half of their fall. After the RPS and in the 1970s it tool 4-5 years and after the 1920 and 1951 highs it took 20 years.
In this scenario it seems reasonable to assume that autumn 2022 the market will have a good chance of recovering around half of the 2020 drop in price, yielding a price rise of 30-40% from the cyclical low. The main caveat to this is that we have not yet seen a confirmed low point in the market, but in terms of timing the scenario is plausible.

What does it mean?
This article is designed to put some plausible timeframes and price movements around a recovery from the current COVID-19 induced downturn. It is less risky to start building stocks after the cyclical low point has been reached, which is not apparent at this stage.
Have any questions or comments?
Key Points
- If the market follows recent recoveries, prices will recover around half of 2020 losses a year or so after the cyclical low has been made.
- The key point to remember is that we do not know when the cyclical low point will be. That is for hindsight to determine.
Click on graph to expand
Click on graph to expand
Data sources: Various, ICS, Mecardo