Corn prices have rocketed steadily for the last six months by over 25%. This market is typically more stable and predictable, so what exactly has caused all the volatility and rapid rise that caught the market by surprise? In this article, we trace how corn futures got from $150 US/Mt at the start of the year, down to $120 US/Mt in April, before snapping back to the level of $160 US/mt, step by step.
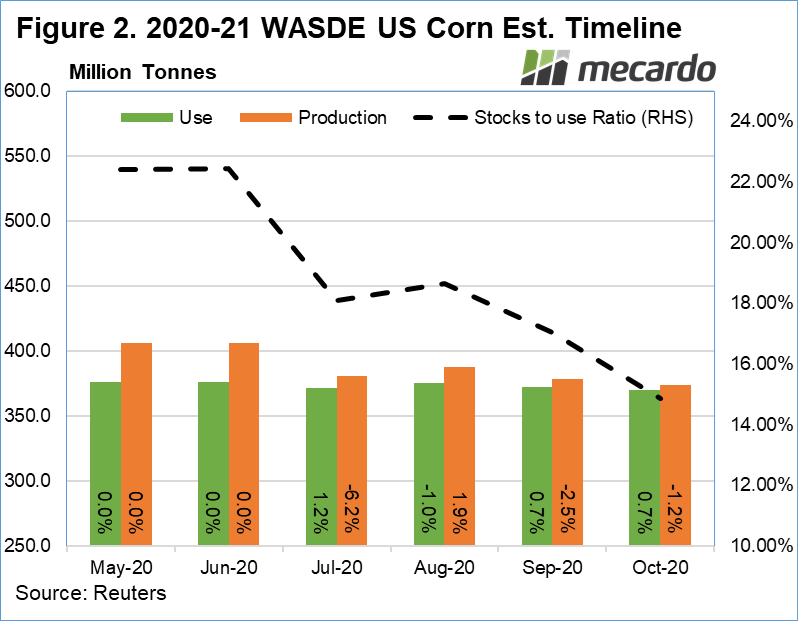
Overall, a number of factors have influenced the corn market this year; a rampant virus; dry weather, lower plantings and the USDA releasing multiple figures (figure 2) that surprised the market. That’s not to mention an actual storm in the US called a Derecho and, finally, China going on a buying spree. A falling ending stocks to usage ratio is an indicator of a tightening corn market in the US. As part of the global feed grain complex, CBOT wheat has also risen more than 15% since April.
Let’s look at these factors in more detail;
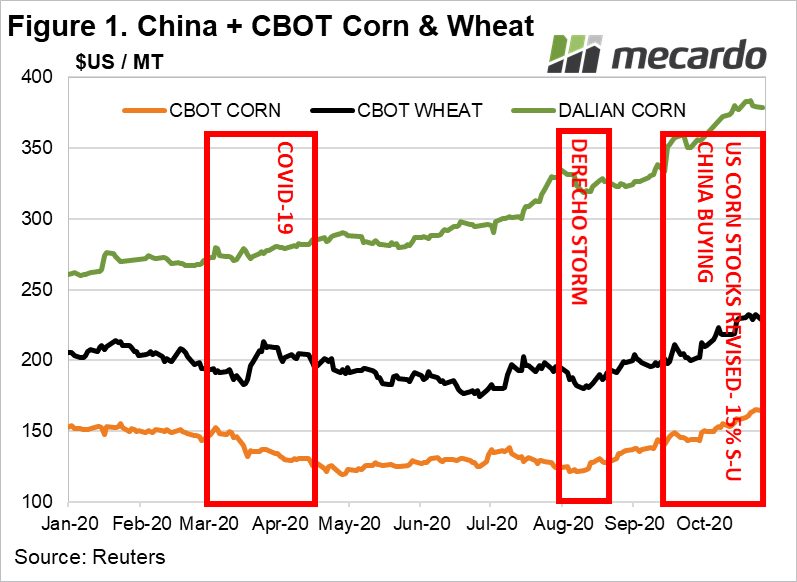
At the start of the year the US WASDE reports were showing no real surprises for the 2019/20 crop and CBOT corn was sitting at $150 US /Mt (figure 1). By March, COVID-19 hit, and by late April, the market sunk to the $120 US/tonne mark.
The May WASDE came out with a forecast planting intention of 97 million acres for 2020/21 which was about 5% higher than many analysts were predicting. With production forecast at 406 mmt, the biggest in years, and high ending stocks predicted, meant a glut of corn and a stock to use ratio of 22%.
In July, the WASDE downgraded planted and harvested acres by over 7%, reducing the production forecast from 6.2% to 380 mmt, which is still a pretty big crop. Stocks to use ratio dropped to a much less bearish 18%. Around this time a dry weather pattern emerged over the US, but storm clouds were on the horizon, literally.
Over August 10th-11th, a howling, 250+ mile wide storm ripped through Iowa and Illinois- the #1 and #2 corn producing states, flattening crops in its wake. The market climbed from $121 to $140 by early September, and then tracked higher to $145 after the September WASDE is released, with the ending stocks to use ratio falling to 17%.
More reports of dry weather in South America and Ukraine began to emerge at this time and the market was flooded with weekly news of China rabidly buying huge quantities of Corn and Soy.
On the 30th September, the USDA grain stocks report reveals that the USDA was overestimating the opening US corn stocks by over 7 million tonnes, or close to 15%. This was incorporated into the October WASDE, which returned a 15% stocks to use ratio, indicating a significantly tighter market; and corn climbed to $165.
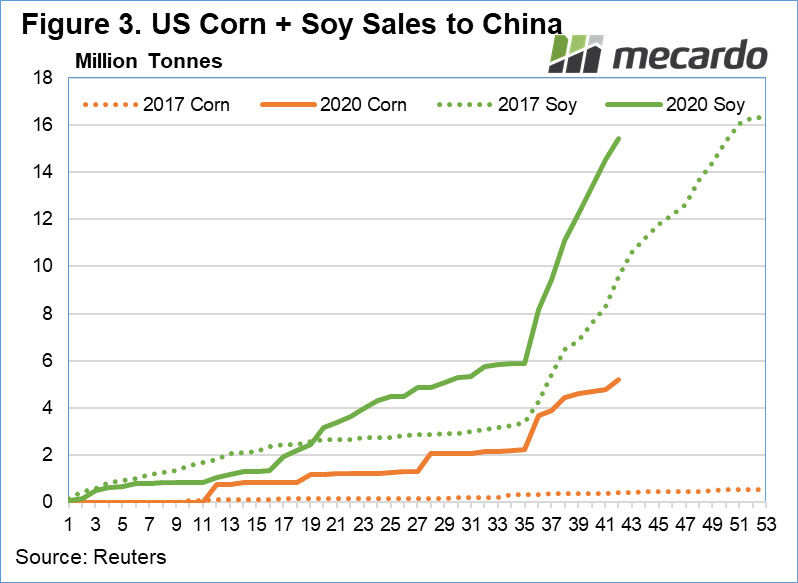
Presently China continues buying from the US rabidly. If we consider figure 3, which shows gross US sales of Corn and Soybeans to China we can see that soybean sales are off to what the USDA has hailed as the strongest start in history. US corn sales to China are on an all-time record, with the USDA estimating sales to be valued at $2b, more than 12 times 2017 levels by this time of year.
The driver behind the Chinese buying is twofold, both commitment under the US-China phase 1 deal to buy 40bn of US agricultural products, and also to support their rapidly recovering pig herd in light of depleted government stockpiles. In figure 1, we can see that Chinese Dalian corn futures are more than double US prices, indicating strong demand.

What does it mean?
Higher corn prices have been driven by increasing perception of a tightening supply demand balance in the US, indicated by a declining stocks to use ratio, and strong Chinese purchasing activity. This can be expected to continue into 2021. If corn prices stay strong, we can expect continued support for the wider grain complex going forward.
Have any questions or comments?
Key Points
- Corn futures have risen more than 30% over the last 6 months of 2020
- Corn is a key feed grain and influences wheat & barley
- Record levels of Chinese purchases have fueled the more recent stage of the rally.
Click on figure to expand
Click on figure to expand
Click on figure to expand
Data sources: USDA, Reuters, Mecardo