Analysis of shipping data can provide a bit of sneak peek at how Australia’s exports of grains are progressing month by month. While the data isn’t perfect, it does provide a picture about how stressed our grain logistics system has been compared to past periods and forecasts about when and where ships will come into port to load and how much, over the coming month.
Data from Reuters provides insight into grain export movements out of Australia. While it probably doesn’t capture every load from every ship that leaves port, it can provide information about how hot our ports are running compared to prior years.
To put the question of accuracy into perspective, the ABARES wheat crop year for 2019/20 is defined as an October to September marketing period. Their export number is 10mmt, while the sum of the Reuters monthly shipping figures for that period was 9.4mmt, meaning that 6% of wheat exports may not have been captured.
2020/21 wheat exports are a different story though, with ABARES at 20mmt, while the Reuters sum comes to 15.2mmt, therefore 25% of shipments may not have been captured. Overall, bear in mind that these numbers are probably a little short, and are therefore considered estimates of minimum export volumes.
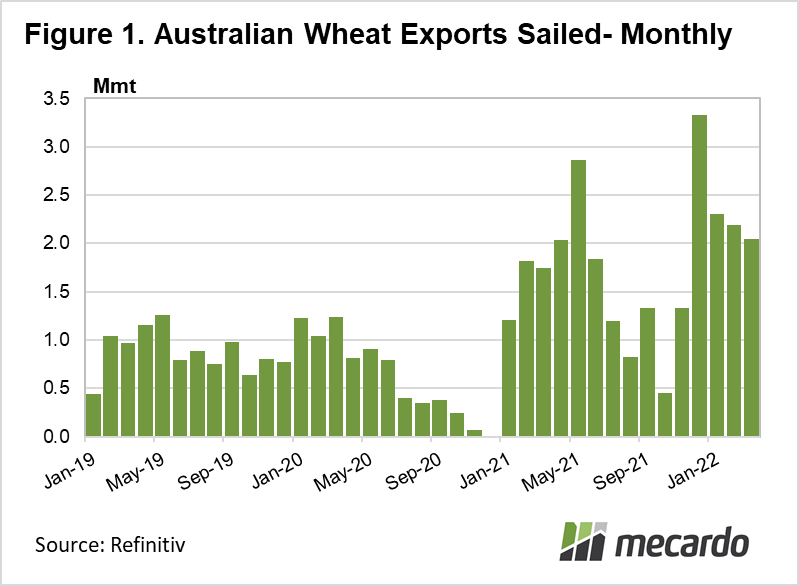
In March 2022, Australia exported at least 2mmt of wheat. This is 17% up from March 2021 (figure 1). On a calendar year to date to March 2022 basis, identified bulk Aussie wheat shipments hit 6.55mmt, which is 86% up compared to the same period in 2021. ABARES is forecasting 25mmt of wheat exports for the 2021/22 marketing year to September 2022. Our sneak peek at our export numbers so far indicates we have currently shipped at least 11.7mmt, which means we are probably more than halfway there.
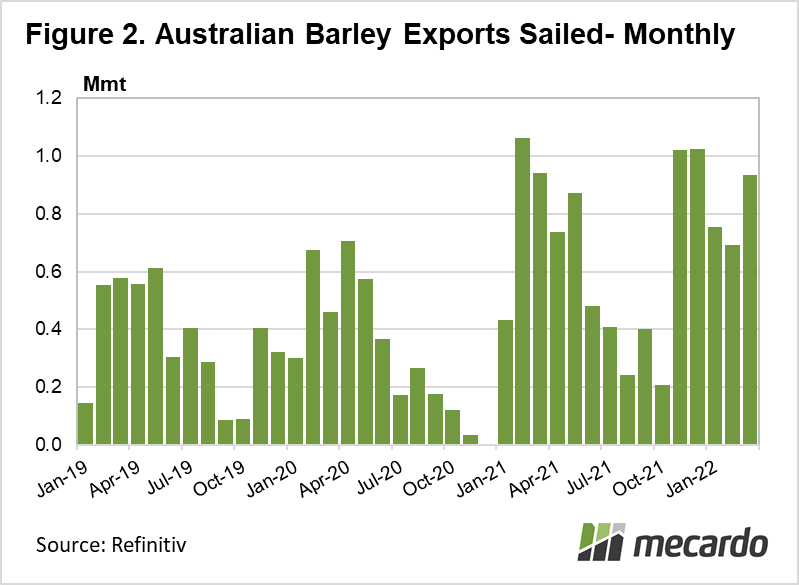
Shifting to barley, for the calendar quarter, barley exports are racing, up 65% on 2021’s pace. ABARES is tipping 8.1mmt of exports for the 2021/22 cropping year. We have already exported 4.5mmt, so we’re at least 55% of the way there, with 7 months to go.
On the canola front, the start of this year got off the blocks at a cracking rate, with 1.6mmt shipped in Q1-22, up 120% from the volume achieved in 2021. March export have slowed compared to last year however. ABARES estimates we will export 5.2mmt in the 2021/22 marketing year. 2.6mmt has already been accounted for, so again, we are possibly over 50% of the way there with 7 months to go.
Looking at the seasonality of Australian grain exports, the summer period from November to May, i.e post-harvest, is typically the busiest, and when the most pressure appears to be on the shipping stem. All indications are that the export pace set in the 2021/22 marketing season has been exceptional, putting strain on grain terminals and shipping stem capacity. If lower volumes flow through the ports over the winter period, and capacity opens up, the export bottleneck may loosen, providing more space for exporters to book new opportunistic cargoes at attractive prices- which they will need to come to market to fill.

What does it mean?
Overall, indications are that the logistics fueled discount to international markets that delivered Aussie grain suffers from currently, will likely reduce, though not anytime soon. This winter, when the export pace normally slows, we may see some serious convergence between Aussie grain prices and the higher Ukraine-crisis impacted high international grain prices.
Shipping data isn’t perfect, and needs to be used with some caution, but it can provide guidance on the typical seasonal profiles of grain exports, and how many ships will be loading in a given month. Higher volumes loading can translate to immediate spot demand for grain in a given month as exporters cover non-contracted exposures, meaning port prices could, in theory have a better chance of lifting.
Have any questions or comments?

Key Points
- 5mmt Wheat, 2.4mmt Barley, 1.7mmt Canola exported in MAR-22
- All major grains are 50%+ for their forecast export volumes for 2021/22
- Export pace currently blistering. Winter may see a slowdown, and opportunity for basis to close up.
Click on figure to expand
Click on figure to expand

Click on figure to expand
Data sources: Refinitiv, MATIF, Profarmer