This article takes a look at auction sales volumes, price and the gross sales value of crossbred wool since the mid-1990s. Crossbred demand has swung between extremes in the past decade, with the current market at one of the extremes.
Crossbred wool prices rose substantially with the 2011 movement up in apparel fibre prices, driven by an extraordinary cotton market. Crossbred prices maintained their gains, and then rose further, finally peaking in early 2019 and then falling quickly back to pre-2011 levels. In US dollar terms the price movement was even starker with the 2011 to 2019 prices looking on price charts like a high plateau. After spending a decade at new, higher price levels it has been a big surprise to see the crossbred market return to low levels, and stay there. While crossbred wool is a small part of the Australian and New Zealand markets it is quite a large part of the South American market. Such a big change in price level for this category of wool warrants some analysis.
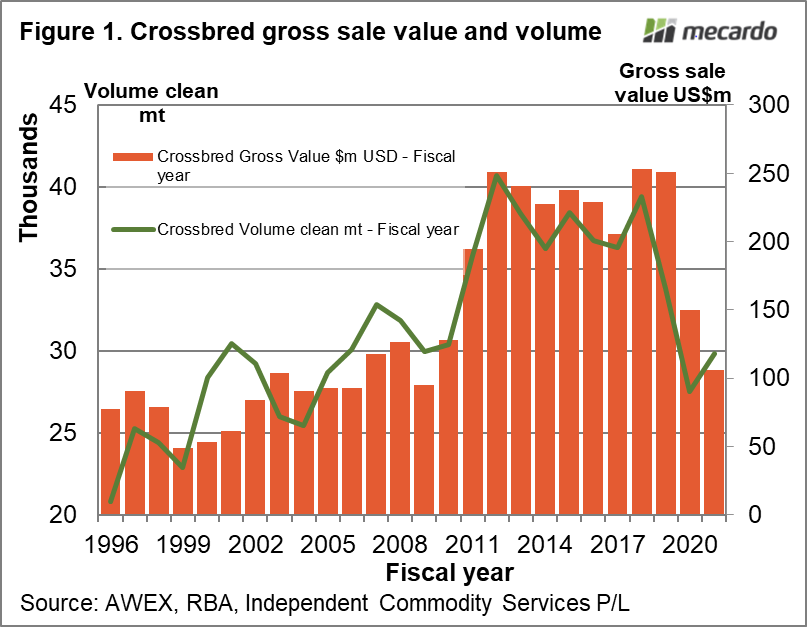
Figure 1 uses the graphics and analysis as used in the recent article on the 21 micron category. Up until the 2009-2010 season, the annual gross sales value (GSV) ranged from US$80 million to US$120 million. From 2011-12 to 2018-19 the GSV jumped to average US$237 million. At the same time volume jumped by around 27% from 30,000 clean mt per season to 38,000 clean mt. In 2019-20 volume and GSV dropped. Some of the drop in volume can be explained as farmers passing wool in and holding it as stock and some of the drop will be explained as wool sold privately as a consequence of the less favourable prices. The current season has 11 months of GSV data and an estimate for the final month (June). The striking thing about the current season GSV is that it has returned to US$100 million, which is in line with the pre-2011 GSV levels. It is if as the supply chain has disregarded the past decade.
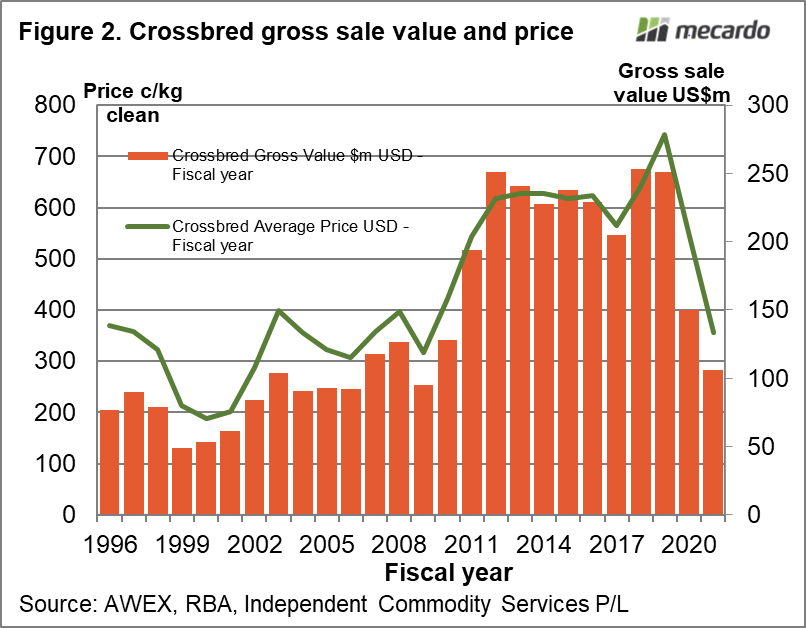
Figure 2 shows the annual GSV and price from the mid-1990s onwards. In 2011 when volume and GSV jumped to new, higher levels so did price. In market terms, this is the best of outcomes – more volume at a higher price. By contrast the Merino market has been buying higher prices with lower volumes for three decades. While the volume and GSV have a strong positive correlation, the average price and GSV have an even stronger positive correlation. The implication is that demand, the amount the supply chain is willing to spend, is a stronger driver of price than volume.
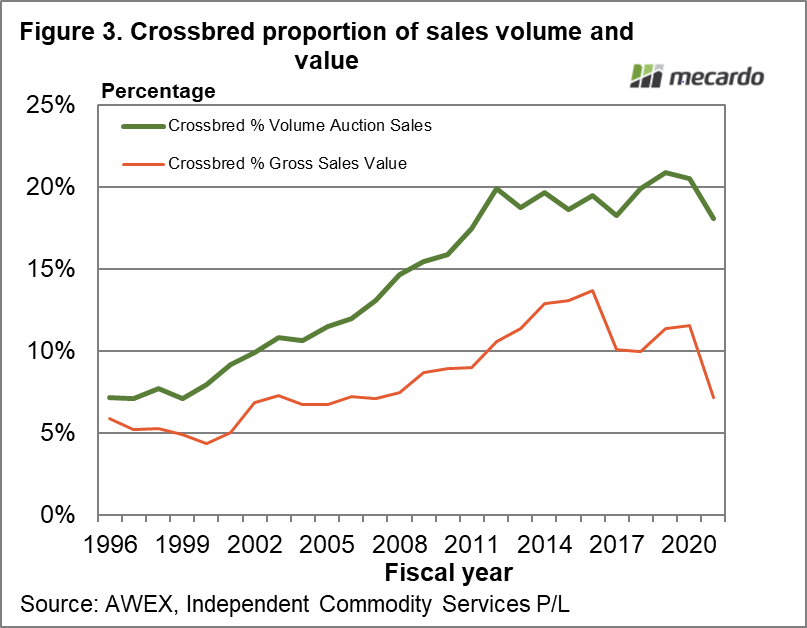
Figure 3 looks at crossbred sales volume and GSV as a proportion of the combined Merino and crossbred market (effectively about 98% of the Australian market). As Merino volumes fall and prime lamb production increases the proportion of crossbred wool sold at auction rise through to around 2011-12, when it stabilises around 19-21%. The crossbred proportion of GSV picks up from a lowly 5% in the 1990s and rises to a peak of 13.7% in 2015-16, before easing to 10-12% as the Merino market recovered from the cyclical lows of 2015. As late as the 2019-20 season crossbred sales accounted for 11.5% of the combined Merino/crossbred sales. It is only in this season that the crossbred proportion of sales has plummeted down to 7%, last seen in 2006-7. Figure 3 suggests that the crossbred GSV has simply not recovered from the shock delivered to the greasy wool market by the 2020 pandemic.

What does it mean?
The concerning thing about the drop in demand for crossbred wool, after a decade of good prices combined with higher supply, apart from the low prices themselves, is the absence of a good explanation. If it can happen to crossbred wool what other fibres/commodities can it happen to? Hopefully, a post-pandemic recovery begins as the supply chain works out how to use cheap crossbred wool in new products, which is the standard cyclical method of recovery in the greasy wool market.
Have any questions or comments?
Key Points
- Crossbred gross sales value has returned this season to the average pre-2011 level.
- In contrast to the Merino market, crossbred sales have yet to begin a recovery from the pandemic shock of 2020.
Click on figure to expand
Click on figure to expand
Click on figure to expand
Data sources: AWEX, RBA, ICS
