The Eastern Young Cattle Indicator (EYCI) has risen to dizzying heights recently. We all know that it’s a reflection of a tight supply and demand situation, but is this year truly extraordinary in terms of how low supply of young cattle is in the saleyards? And have changes in the average weight of cattle offered this year played a role?
In markets, the relative strength of supply and demand for a commodity is key to the positioning of the equilibrium price. Supply of young cattle into the saleyard auction markets appears to have never been tighter in the last decade, at this time of year. Presently, the volume of EYCI eligible cattle being traded is regularly in the range of 11,000-13,000 head per week mark. This is more than 20% below the five-year average for this time of the year, which is around 16,000 head per week.
To put the supply situation further into perspective, we can look back further in time to another year when restocking occurred in earnest, 2016. At this time of the year in 2016, EYCI eligible young cattle volumes averaged around 20% higher than they have in the last month. This highlights how tight supply is this season compared to the last significant restocking phase.
The EYCI encompasses a fairly wide range of cattle weights, from 200kg to well over 400kg LWT. As such, the way that the EYCI is calculated, not only represents changes in the price of young cattle within the market, it also has the potential to be influenced by the distribution of weight specifications being sold in the market at any one time, because the relative number of cattle in each weight range is not fixed. For example, if the proportion of very light cattle making up the EYCI increased over time, the EYCI would be pushed up, even if market prices for cattle remained static because light cattle are more expensive generally.
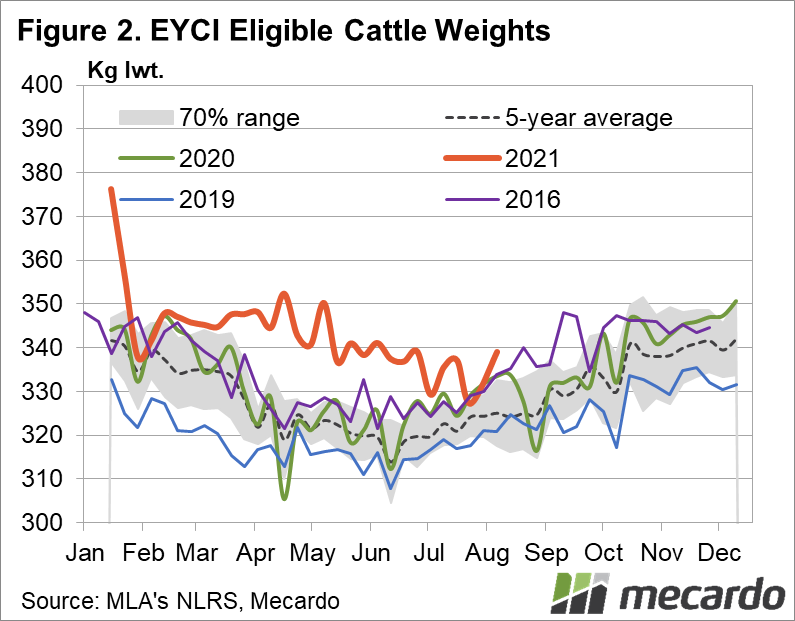
Given the high prices being fetched for very light young cattle at the moment, this raises the question about how much of the EYCI’s rise is related to any change in the distribution of specification or a change in market price. A way to investigate this is by looking at the average assumed “weight” of the EYCI. This is not straightforward because the exact weight of cattle in the index is not explicitly recorded – they are placed into one of five fairly wide weight ranges between 200 and 400kg+. However, by making a few consistent assumptions about the average weight within each specified range, we can generate an approximate EYCI weight index. The result of this analysis shows the effect of the good season in 2021, with the average weight of cattle within the EYCI at 340-350kg, it’s around 5-6% higher than the five-year average.
This indicates that, if anything, the EYCI potentially has a downward bias in it on a like-for-like basis, compared to other years due to heavier weights

What does it mean?
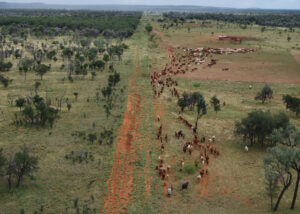
What is clear from looking at the numbers of young cattle being traded in the market this year, is that the volume of cattle that producers are letting go has decreased markedly. Add that to increased demand for restocking stemming from good pastoral conditions and the fundamentals are there to support the strong prices we are seeing at the moment.
Have any questions or comments?

Key Points
- Supply is very tight, EYCI volumes are down 20% in 2021.
- Cattle within the EYCI are heavier than ever, 5-6% above average.
- Higher weights bias the EYCI downwards, prices may be higher than it appears.

Click on figure to expand
Click on figure to expand
Data sources: MLA, Auctionsplus, Mecardo