Seasonal price patterns can be useful when making a decision to hold wool back from sale or to push it into sale, but they are not stable, nor strong enough to base such a decision entirely upon. Mecardo takes a look at the 21 micron seasonal price pattern in this article.
Mecardo last looked at the evolution of the 21 micron seasonal price pattern in January 2021. Not a great deal has changed but it is worth refreshing the history of seasonal price patterns, in this case for 21 micron, in recent decades. The 21 micron indicator is used for this purpose, now known as the 21 MPG.
The seasonal pattern is developed by creating a rolling 12 month centred moving average and taking the variation of the weekly price from this average. The median variation is calculated for each week, with the full 52 week median series of the selected period then corrected for trends.
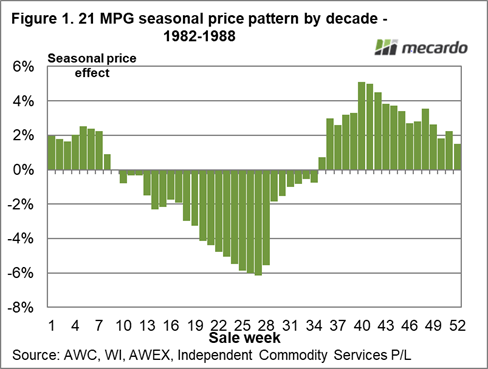
Figure 1 shows the median seasonal price pattern for the period 1982-1988, the glory days of the Reserve Price Scheme (RPS). 1989 and 1990 have been omitted from the analysis due to the activity of the RPS at the time, when it built up significant levels of greasy wool stock and ultimately failed in spectacular fashion. The horizontal axis shows the weeks of the wool selling season from week one to week 52. In the 1980s late spring was the time of weakest prices and the March quarter the time of strongest prices.
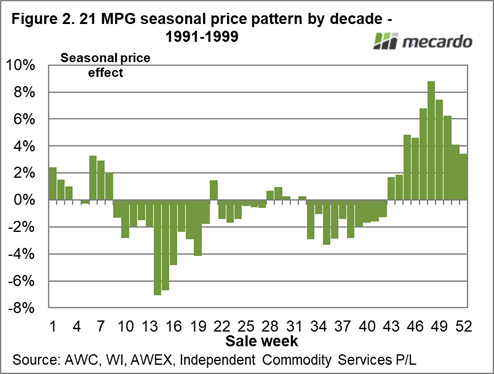
Figure 2 shows the seasonal price pattern for the 21 micron indicator during the struggling 1990s when the industry endured low prices as it gradually sold off the RPS stockpile. Weeks 14 and 15 (around early October) were the bogey weeks for low prices, while the market after Easter tended to be the best time during the season.
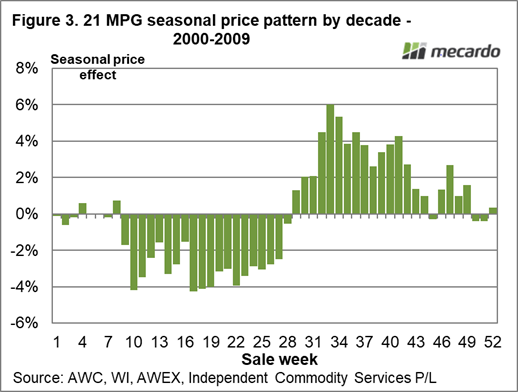
Figure 3 shows the seasonal pattern for the 2000s, a period when the RPS stockpile was finally liquidated, the fine merino market had a very strong boom early with the Australian merino clip lowering its average fibre diameter by 1.5 microns across the decade. Price weakness in the first half of the season continued with the strength in price during the second half creeping forward into January.
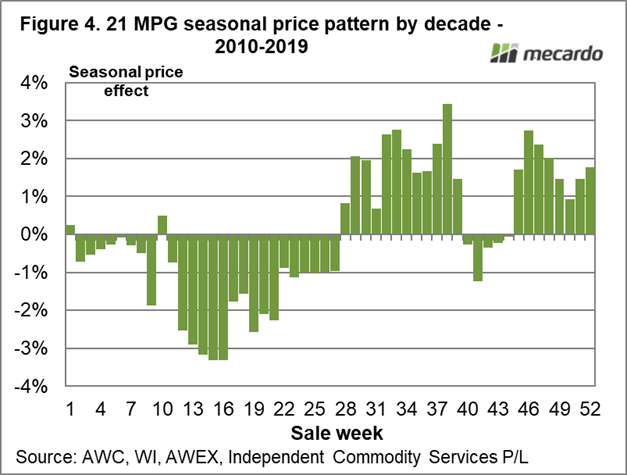
The final schematic shows the season price pattern for 2010-2019. In this period price has had two major rising cycles (2011 and 2017-2018) and two big down cycles. The spring price weakness has focused on October (although in some years it has been August when the major lows have arrived) with the price strength in the second half of the season more spread out. Note the strength of the seasonal pattern in percentages terms has been the lowest in this decade compared to earlier decades.
What does it mean?
Seasonal patterns can be easily overridden by major price cycles where prices move by 30-50% on the downside and by 50-100% on the upside over a number of years. Seasonal patterns are relatively weak in comparison to these larger cycles and they vary with time, therefore they are of secondary importance when deciding to hold wool back from sale.
Have any questions or comments?
Key Points
- Seasonal patterns evolve with time. They are not static.
- Price weakness for the 21 micron indicator is generally in the spring with strength in price sometime in the second half of the season.
- The seasonal pattern of the past decade has been the weakest of the past four decades.
Click on figure to expand
Click on figure to expand
Click on figure to expand
Click on figure to expand
Data sources: AWC, WI, AWEX, ICS


