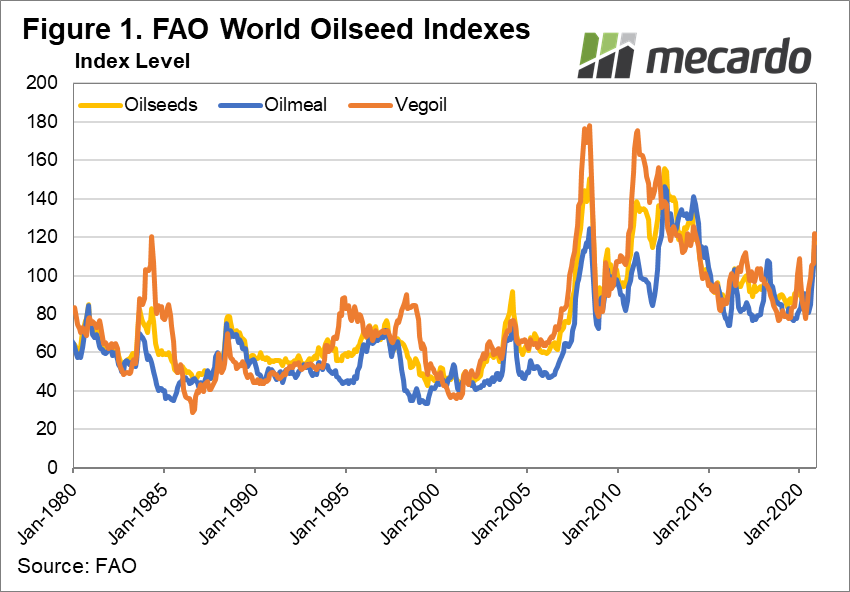
The FAO publishes a set of indices monthly that track the collective fortunes of the global oilseed complex and its derived products. The indexes cover oilseeds, feed oil meal, and vegetable oil markets, across the key crops grown across the world ranging from soybeans, rapeseed and sunseed to the more niche products in the complex like coconut, groundnuts and flaxseed. The indexes are based on pricing delivered into the EU, which is an important market for Australian Canola. Since September, the FAO indexes have leaped 16-24%, with veg oils booking a 15% rise in November alone.
The FAO oilseed index series consist of three representative figures calculated from average prices observed in the market each month weighted by each commodity’s significance in the global market in terms of relative total value over the 2014-2016 period. The prices utilised to build the indexes are mostly referenced for delivery in the EU, primarily Rotterdam.
The oilseed index covers 5 main commodities soybeans, rapeseed, linseed (flax) sunflower seeds and copra (coconut kernel), delivered cif (cost, insurance, freight) to Rotterdam or Hamburg.
The vegetable oil index is constructed from the prices of 10 key vegetable oils commonly traded in the world marketplace: soy oil, sun oil, rape oil, coconut oil, crude and refined palm oil, linseed(flax) oil, groundnut oil (a relative of the peanut), and castor oil.
The oilseed feed meal index is built from the pricing of soymeal, sun seed pellets, rape meal, copra pellets and palm kernel meals.
Currently, the indexes are at levels that are the highest since 2014, emphasising the general strength of the entire oilseed market at present. (figure 1)
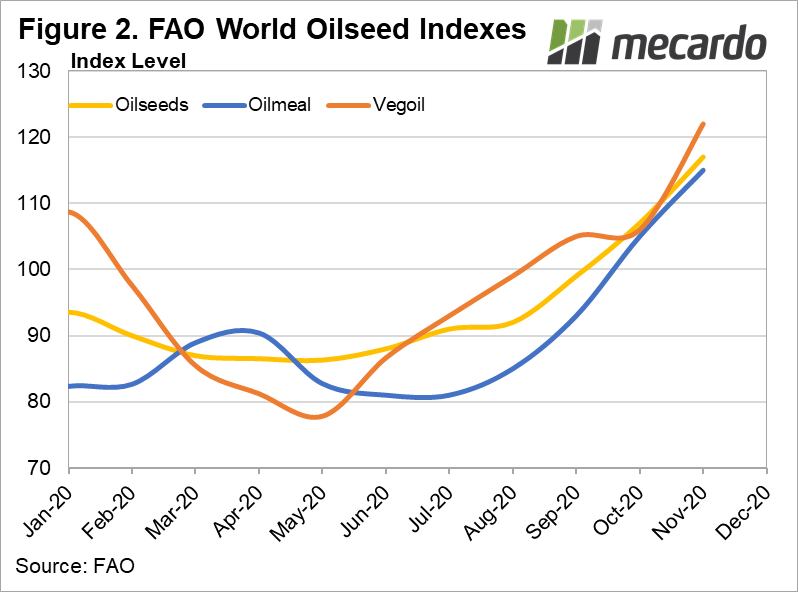
Looking more closely, since Jan 2020, the oilseed index has risen 30%, feed meal by 43% and veg oils by 20%. (figure 2) In November alone, the steep rise of the oilseed index of around 10% was driven primarily by higher market values of soybeans, sunflower seeds, and rapeseed, but to a lower extent.
Soybean price increases have been motivated by persistent concerns about an extended period of dry conditions in South America, and, despite recent rains, scepticism in the market about yield potential for crops already in the ground that may have been damaged by drought at a critical stage of early development. Sunflower seed prices are also at their highest level since 2013, on the expectation of poor crops in the black sea region due to serious moisture deficits occurring during the critical growth stage of the crops. Rapeseed (Canola) supply has been tight in the EU, underpinned by export availability falling in Canada due to strong demand from Canadian crushers.
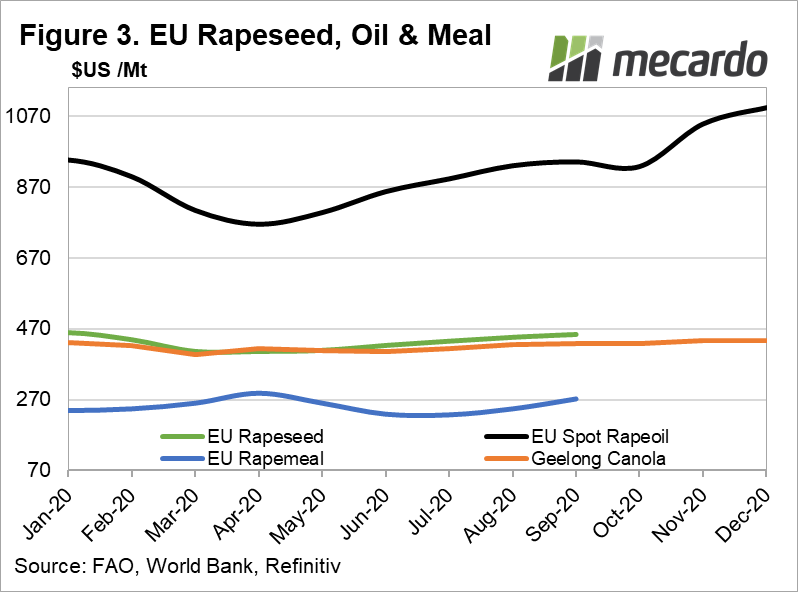
Prices for rapeseed products, and particularly rapeseed oil, delivered to the EU, which has risen 44% from its April low in $US terms, have seen solid upward momentum over 2020 despite the impact of covid-19 lockdowns on transportation, and hence bio-diesel demand. (figure 3)
Australian canola, ex Geelong, has only lifted 8% from its Jun-20 low, but the clear buoyancy displayed in European markets for rapeseed, and oilseeds in general is encouraging.

What does it mean?
The set of FAO oilseed complex indexes provide a single yardstick figure that can be used to quickly assess the relative market strength and identify general trends in the global market for most significant oilseed crops that are impacting our key export market for canola, Europe.
The strength in the index recently indicates that there should be a significant amount of support for the Australian canola prices this season.
Have any questions or comments?
Key Points
- The FAO oilseed index series is a set of three calculated indexes; oilseeds, feed oilmeals and vegetable oil
- In 2020, the oilseed index has risen 30%, while feed oilmeal has jumped 43%, and vegetable oils are up 20%. These are the highest since 2014.
- The indexes are mostly constructed from prices delivered to Rotterdam in the EU, so can provide guidance on the export demand for Australian Canola.
Click on figure to expand
Click on figure to expand
Click on figure to expand
Data sources: Reuters, USDA,
Mecardo.