The article on micron price curves and discounts for various types of merino wool published last week prompted a request from Uruguay for a longer term look at these facets of the greasy wool market. This article takes a look at the average curves and discounts for the past five years.
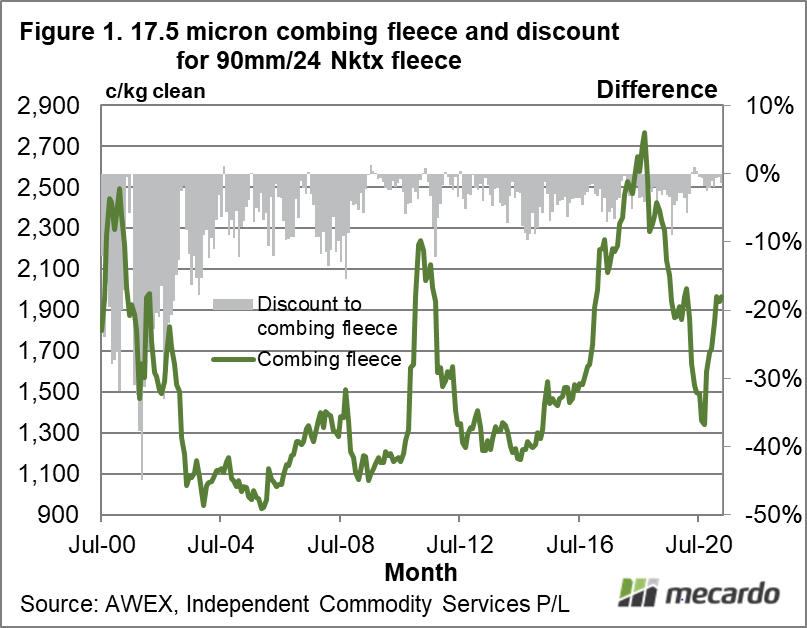
One of the challenges in looking at premiums and discounts across time is that it introduces time as a third factor, making it harder to visualise how the relationship of premiums and discounts across different micron categories compare. With this in mind Figure 1 shows the prices series for 17.5 micron combing fleece from July 2000 onwards (in Australian dollar terms) along with the discount for 17.5 micron 90 mm long fleece with a low staple strength of 24 N/ktx (grey columns referring to the right hand scale). It shows the discount for low staple strength shrinking markedly from 2000 through to 2010, and then stabilising to trade within a range between 1% and 10%. For the balance of the article, five-year average price curves and discounts are shown, as this period has seen a relatively stable structure for premiums and discounts.
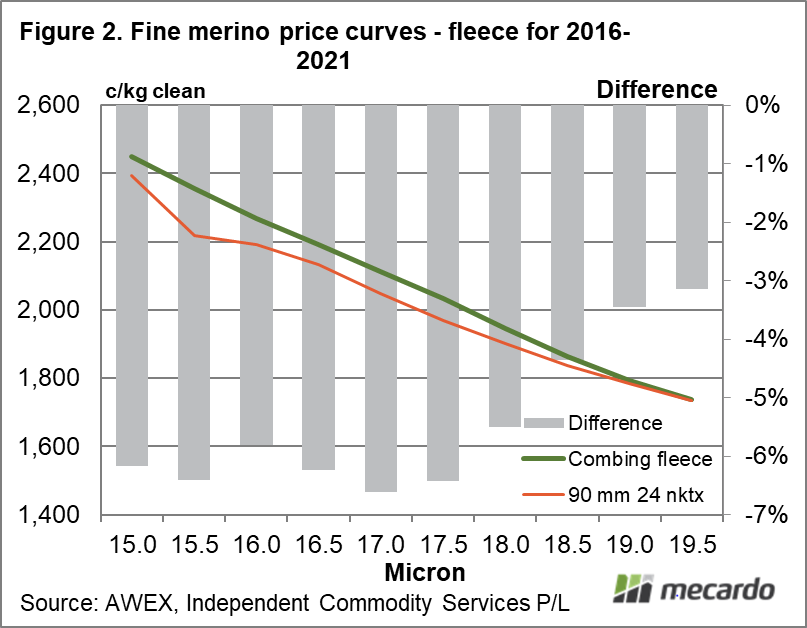
Figure 2 compares two five-year average (2016 to 2021) price curves for merino fleece between 19.5 and 15 micron. The base series used is an average of combing length fleece (with a staple strength above 30 N/ktx, vegetable fault below 2% and o subjective faults beyond light scourable colour – H1) while the second price series is based on low staple strength (24 N/ktx) fleece. The bars (right-hand scale) show the difference between the two series. The article last week showed the discount to be generally below 2%, whereas the average discount during the past five years has been 6-7% for 17.5 micron and finer wool, with the discount shrinking for 18 micron and broader wool.
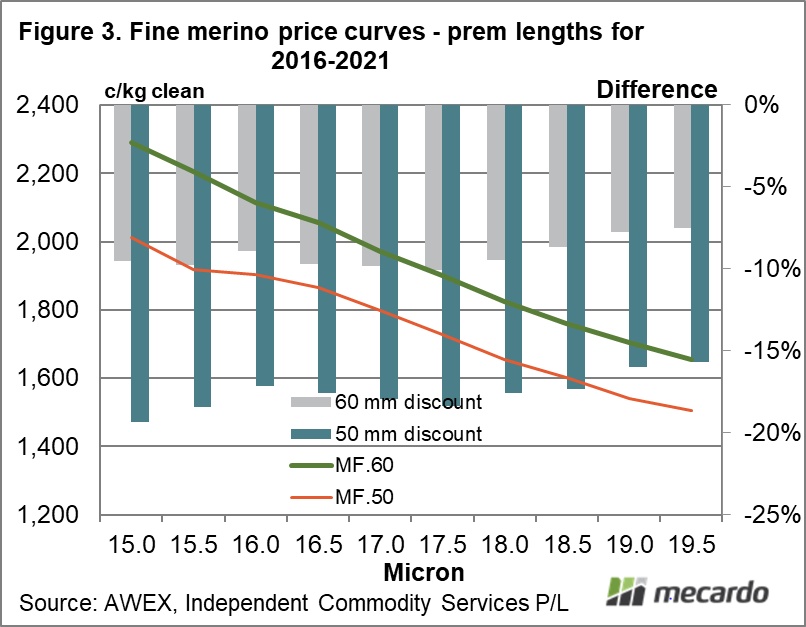
The third schematic (Figure 3) shows price curves for 50 and 60 mm long merino fleece, with discounts to the base combing fleece series (from Figure1) shown by the bars. It shows the 60 mm length discount to range between 8% and 10%, while the discount for 50 mm is much wider (ranging between 16% and 19%).
The discount for the merino pieces series shown in Figure 3 aligns closely with the midway point between the 50 and 60 mm length fleece discounts, which is similar to the current market structure.
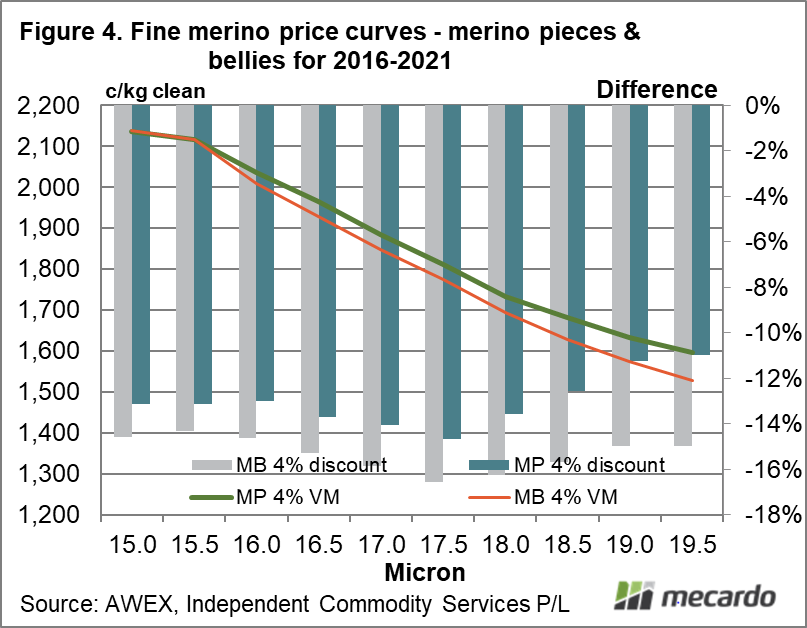
Figure 4 compares merino pieces and bellies with a vegetable fault of 4%, with the bars showing the discount for these series to the average combing price. Typically the bellies are discounted by 2-4% to comparable pieces.

What does it mean?
Merino piece prices tend to be aligned with fleece types used in the knitwear sector (such as low tensile fleece and short-staple length fleece), which is evident in the longer-term data and the current data shown last week. Knitwear types are outperforming the longer worsted types, and this is evident in the smaller discounts in the current market relative to the longer-term five-year averages shown in this article.
Have any questions or comments?
Key Points
- The longer-term five-year averages for low staple strength discounts are appreciably higher than in the current market.
- It is a similar story for the discounts for 50 and 60 mm.
- Merino pieces, with a vegetable fault of 4%, tend to be discounted at similar levels to 55 mm fleece, a feature evident in the five-year averages and current market.
Click on figure to expand
Click on figure to expand
Click on figure to expand
Data sources: AWEX, Independent Commodity Services P/L , Mecardo
