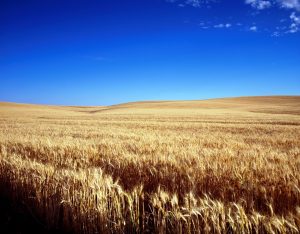
Grain pricing is fundamentally all about the balance between supply and demand, but while grain is highly storable, at some times of the year, there can be more intense selling pressure in the market as harvests are brought in, and some sellers have a strong preference for marketing their grain immediately.
The tidal wave of grain being brought in by a new harvest can have the transitory effect of suppressing prices due to a temporary surge of selling pressure coming from a cohort of sellers whose marketing intentions are less flexible than others. The impact of harvest can even vary between the international and more local marketplaces in each country.
Of the roughly 750mmt of wheat that are grown on average across the globe, 82% is produced by the top 10 countries. Of this gross production, only around 200mmt, or 27% is exported. The largest exporters by volume are Russia, the EU and Canada, while Australia currently sits in around 4th or 5th place.
Wheat imports are less concentrated than exports, with only roughly 80mmt of the total 200mmt global demand sitting in the top ten countries. The largest wheat importers are typically Egypt, Indonesia, Turkey and China.
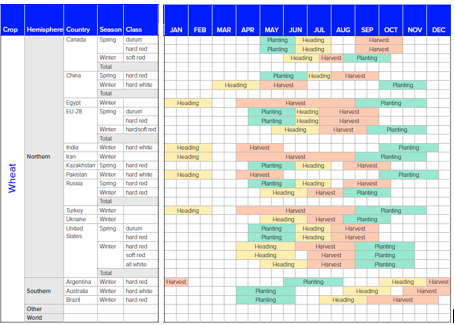
The profile of global wheat production can be broadly broken up into two main regions, the Northern and southern hemispheres. The northern hemisphere, which includes Russia, the US and EU, predominantly harvests between July and September, with the Canadian spring wheat harvest extending out to October. In contrast, the key exporting producers in the southern hemisphere Australia & Argentina harvest between November and January. (See the global wheat cropping calendar)
In terms of volume, the vast majority of wheat produced in major exporting nations emanates from the northern hemisphere, with Australia & Argentina the outliers that account for only around 50mmt production, and 30mmt exports.
When considering harvest pressure on prices in an international context, clearly, major exporting and importing nations in the northern hemisphere are the key consideration.
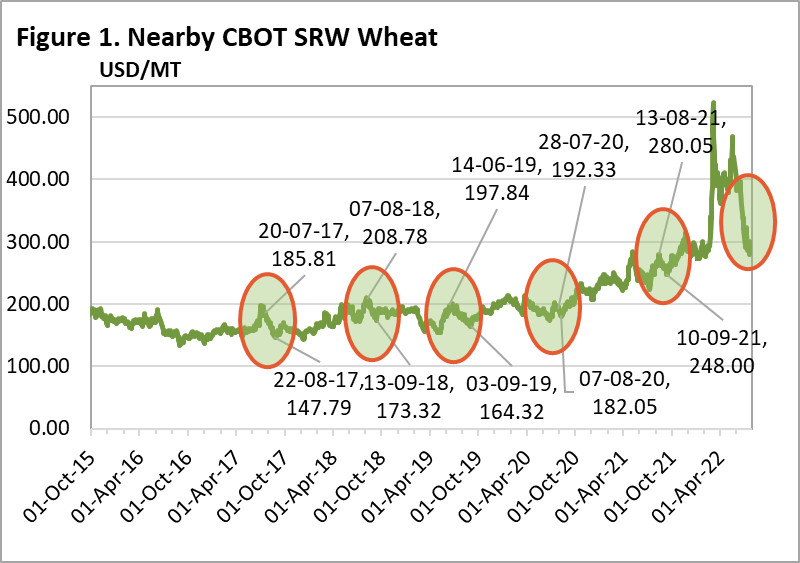
If we look at the price fluctuations of CBOT SRW wheat, (figure 1) for example, while there was wet weather during the US harvest that caused prices to pick up somewhat in prior years like 2018 & 2019, there were points where prices dropped in excess of 20% within the harvest period. The price fall seen in 2022 over the last month has not been driven exclusively by news about grain exports resuming out of Ukraine either. USDA estimated that 82% of US winter wheat was harvested as of last week, and additional supply into the system has, by definition, a bearish impact on price.
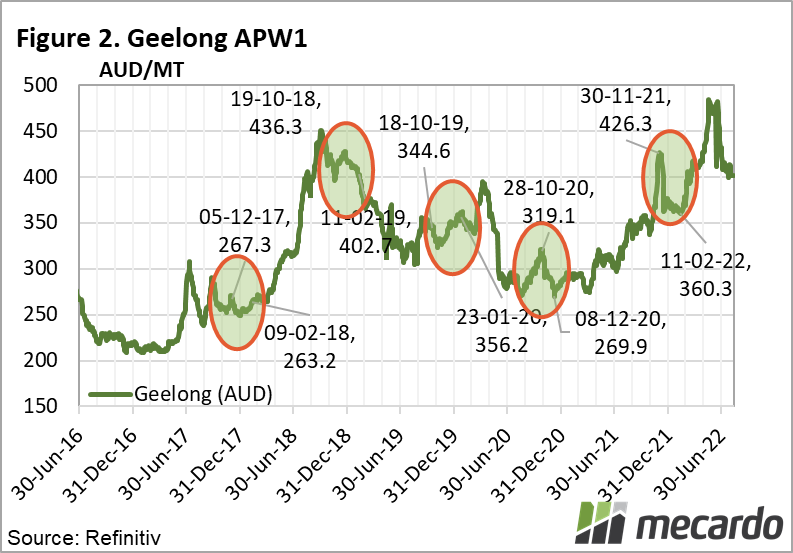
In an Australian context, in figure 2, we can see evidence of downward pressure on prices as headers sweep across the fields between November and January in many years, (though not all; for example, the 2019/20 harvest season)
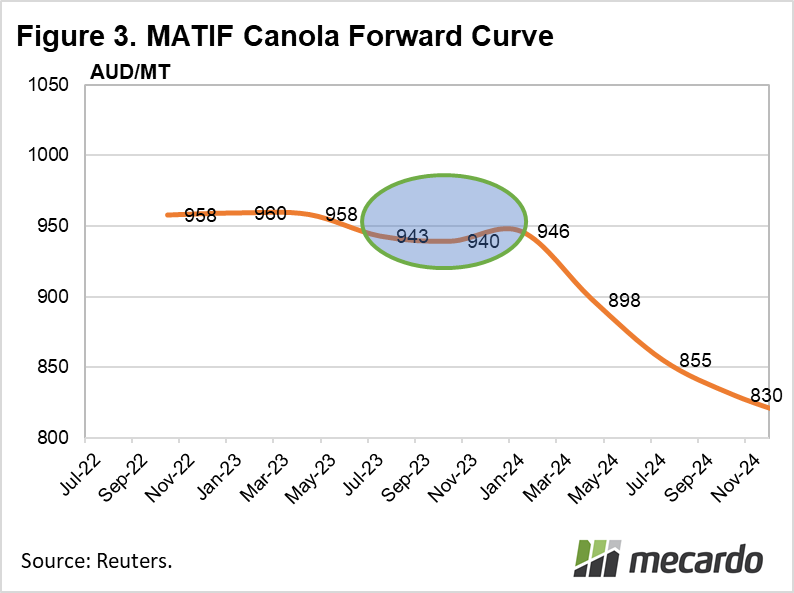
The principle applies for other agricultural commodities also, such as MATIF canola. There, the depression in shape of the forward curve is reflective of the impact caused by new supplies coming into the marketplace when the EU crop is harvested between July and August. (figure 3)

What does it mean?
The harvest of a new grain crop creates a short term surge of supply in the market, which has the impact putting downward pressure on prices, especially on a localized level, because everyone is looking to sell at once. The futures forward curve can sometimes reflect the main points of supply influx. The takeaway from this is that the depth of the resultant price depression can be transitory, and might just be followed by an improvement later in the year.
Have any questions or comments?

Key Points
- Grain harvesting is staggered across the globe due to seasonal differentials.
- The main points of harvest pressure occur in the northern hemisphere when winter crops are brought in.
- The impact of harvest pressure can show up on both spot and futures markets, for various commodities.
Click on figure to expand
Click on figure to expand
Data sources: Refinitiv, Profarmer, CME, MATIF Mecardo.