The week was characterised by the influence of the holiday break, with fewer buyers and sellers coming to market. Prices generally tracked into softer territory due to slack demand, as transport availability was hindered in some areas.
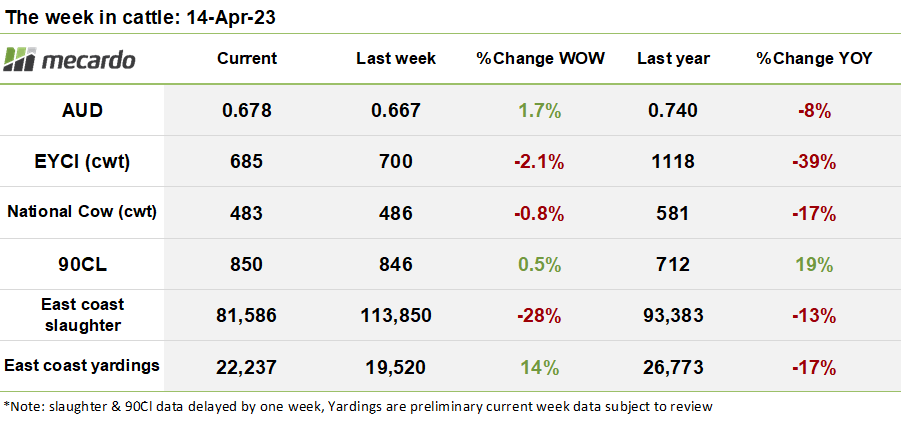
The Eastern Young Cattle Indicator (EYCI) seems to have settled into a holding pattern over the last month or so, operating in the range of between 660¢/kg cwt and 700¢/kg cwt. This week was no different, with the index oscillating down 15¢ (2%) to close the week at 685¢/kg. The Easter break brought with an expected significant reduction in eligible yardings for the index, with just 6,634 head passing through saleyards. This is less than half the 14K head average seen over the course of February and March. Given that prices also slipped despite the tighter supply situation, it can be deduced that buyer demand also backed off.
Dubbo, Roma, and Dalby took the usual lead, contributing 52% of the index volume, with steers respectively trading at 739¢/kg cwt, 754¢/kg cwt, and 739¢kg cwt. The activity was lacklustre elsewhere, in Armidale steers traded at 639¢/kg cwt, while Shepparton steers moved at 730¢/kg.
The Western Young Cattle Indicator (WYCI) rebounded upward by 49¢ (6%) for the week, closing at 714¢/kg cwt. In contrast, steer prices falling8¢ (1%) week on week to close at 642¢/kg. Vealer percentages in the index remained relatively stable at 81%, however, a big 16% week-on-week lift in vealer heifer prices provided the upward impetus in the index.
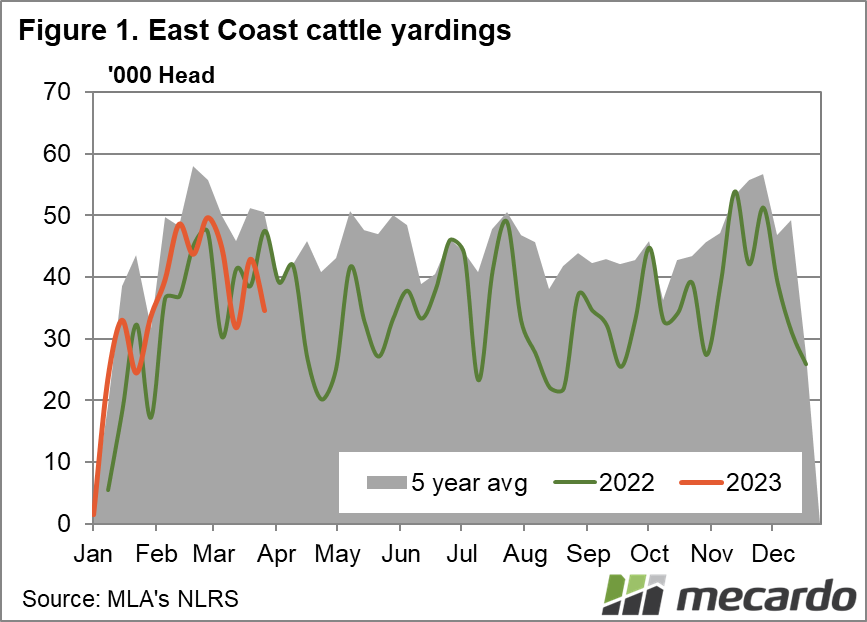
Preliminary east coast yardings overall remained subdued compared to pre-holiday volumes this week, sitting at 22,237 head. Public holidays are expected to continue to weigh on overall supply for the remainder of the month as regional easter show holidays and Anzac Day cause selling dates for some yards to be skipped.
Slaughter numbers for the week ending the 7th of April collapsed by 28% compared to the prior week, down to 81,586 head as public holidays chewed into the number of days and personnel available to process and transport cattle. The April slump in throughput is a historical feature every year, and we can expect subdued processor demand to continue until a pickup in early May as the interruption of multiple public holidays ends.
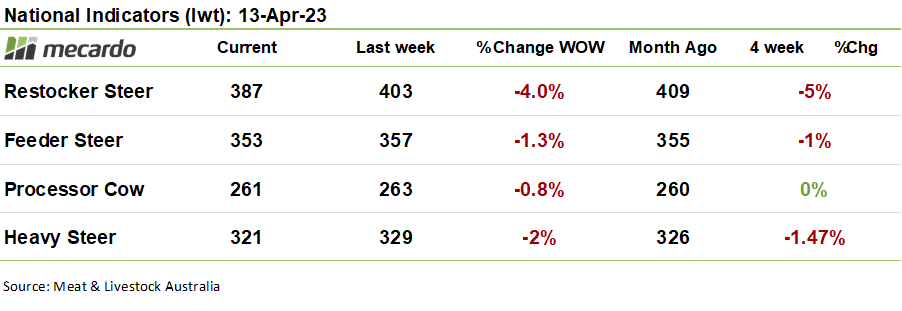
The national indicators all dipping lower can be seen as reflective of a general withdrawal of interest from buyers across multiple categories. The national restocker steer index won the wooden spoon this week, clocking in a 16¢ (4%) week-on-week fall, settling at 387¢/kg lwt.
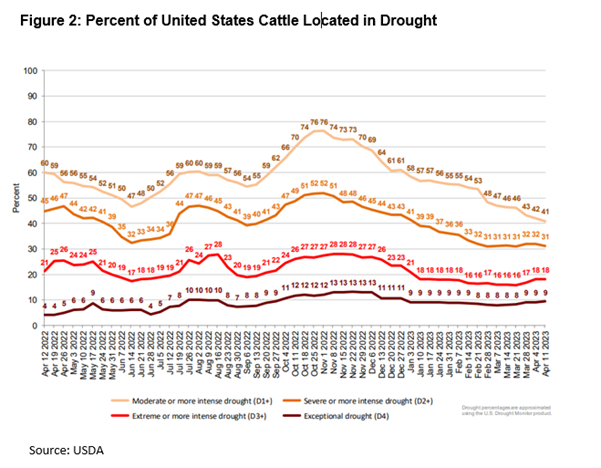
After a momentary dip last week, the US imported 90CL frozen cow price has recovered 4¢ (<1%) to bounce back up to 850¢/kg swt, with the strengthening of the Aussie dollar against the US greenback offset by an increase in the 90CL price in US dollar terms. US cattle prices have pushed higher recently as US holidays tightened cattle supply, while processors strove to find numbers to keep up production, weighing upon cow slaughter rates. While the US drought situation has steadily improved, with the percentage of US cattle areas in drought dropping from 47% at the start of March, down to 41% currently, that still leaves many producers in a difficult situation. This means that the US liquidation phase may be prolonged. As the US herd contracts further, this will set the scene for a significantly tighter supply outlook, and elevated prices in the longer term. This is likely to create an extended period of favourable conditions for exporters of beef to the US like Australia.

The week ahead….
Fewer public holidays next week are likely to drive a lift in both slaughter and yardings and a reshuffle of numbers into saleyards that are still operating. Historically though, we don’t see volumes recover significantly until after the disruption of Anzac Day has passed. With demand subdued, and focus shifting to cropping for some buyers; we can probably expect prices to drift sideways at best next week.
Have any questions or comments?
Click on graph to expand
Click on graph to expand
Click on graph to expand
Click on graph to expand
Data sources: MLA, USDA, Mecardo
