
Lockdowns due to COVID-19 have impacted the wool market and other apparel fibre markets. It is some two years since Mecardo looked at the cotton market, in which time the cotton price has eased in line with the general down cycle in apparel fibre prices. This article takes a look at the situation in the cotton market in light of the effect of COVID-19.
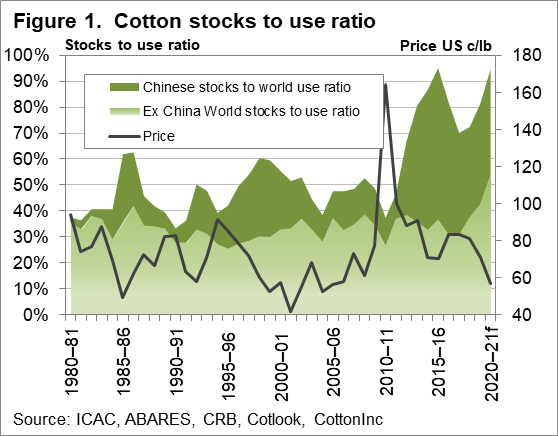
In 2014-15 Chinese stocks of cotton helped to push the stocks to use ratio up to around a massive 95% level. The stock component outside of China (ex-China) hovered around 35% which was a fairly normal level. Figure 1 shows annual opening stock level (projected for 2019-20 and forecast by ICAC for 2020-2021) broken into Chinese stocks and ex-China stocks, along with an average cotton price series. The extraordinary 2011 peak in cotton prices stands out. Cotton prices held up reasonably well from 2014-15 onwards under the very high stock levels, helped by China holding such a large share of the stocks.
As with greasy wool, cotton prices had been easing since 2018, with stocks rising. Then came COVID-19 in 2020, adding an extra boost to the down cycle. Figure 1 shows that stock levels are projected to return to 95% of use, with the cotton price projected to fall again next season.
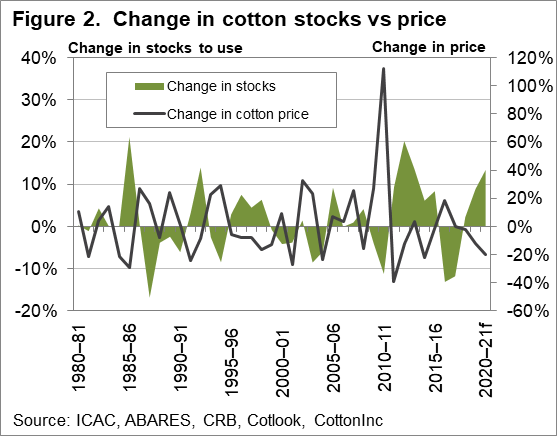
Figure 2 compares the season on season change in stocks to use and price, with the forecasts by ICAC for next season included. There is a negative correlation between change in the stocks to use ratio and price. With the rise in stocks to use, price falls which reflects weaker demand.
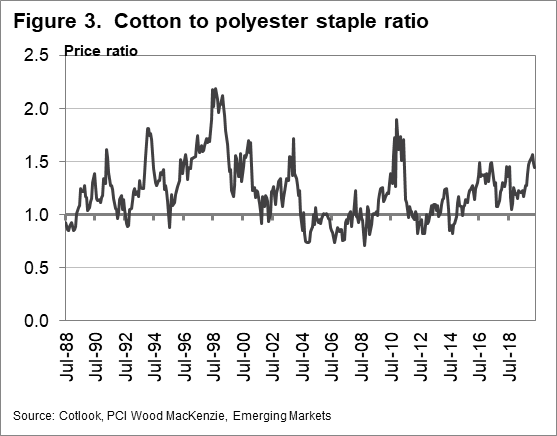
One of the measures the cotton industry watches in the cotton to polyester staple fibre price ratio. Figure 3 shows such a ratio from the late 1980s to last month. Currently the ratio is sitting around 1.45 which is on the upper side of the range although the ratio has spent some time near this level in recent years. The ratio shows there is plenty of scope for a lower cotton price in relation to polyester.
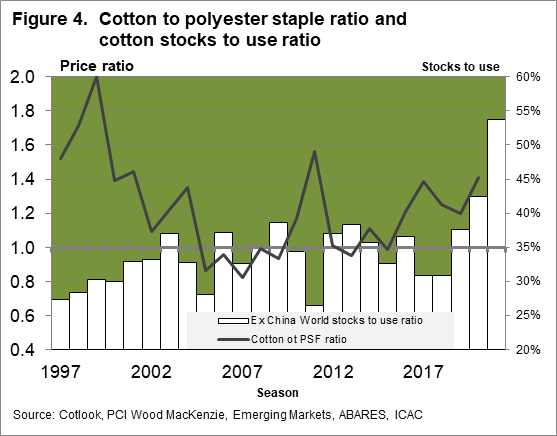
Figure 4 shows annual cotton to polyester price ratio from the late 1990s to this season, compared to stocks to use ex-China. The stocks to use ex-China helps to explain why the cotton price has held up so well in recent years despite the high levels of world stocks to use (including Chinese stocks). In the F2017 and F2018 seasons the ex-China stocks fell to around 31%, quite a low level.
This helped support a higher price with the cotton to polyester price ratio trading up close to 1.5. Now, notice the projected opening stocks to use ratio for next season (as of mid-2020). It will be significantly higher than any ex-China stocks to use level seen in the past two decades hence the ICAC projection for cotton price to fall by 20% next season.

What does it mean?
The development of large cotton stocks outside of China to levels well above the normal 30-40% upper range explains why ICAC are projecting cotton prices to be 20% lower in 2020-2021. With the increase in greasy wool stocks putting downward pressure on the wool to cotton price ratio, the lower cotton prices will help pull wool prices lower.
Have any questions or comments?
Key Points
- Cotton prices have been falling since 2018 and stocks have been rising, in line with the down cycle in apparel fibre prices
- With the advent of COVID-19 in 2020, demand has shrunk badly with stocks to use expected to be around 95% in mid-2020, with stocks to use ex-China between 50% and 55%
- The high level of cotton stocks ex-China is likely to be associated with lower cotton prices (ICAC are projecting a fall of 20%)
- The cotton to polyester staple price ratio has plenty of scope to fall
Click on graph to expand
Click on graph to expand
Click on graph to expand
Click on graph to expand
Data sources: ICAC, ABARES, CRB, Cotlook, Cotton Inc, PCI Wood Mackenzie, Emerging Markets, ICS


