It would be fair to say if you are from southern Victoria, into south east South Australia, and look over the fence as driving around it is easy to think crossbreds are increasing as a proportion of the flock and wool clip. This article takes a look at trends in the supply of crossbred wool in Australia.
Crossbred is a vague term when thinking about wool as it means different things in different parts of the world. In the Australian context it generally means non-merino and non-pure downs wool finer than 32-34 micron. The Kiwis call this mid-micron wool. Auction data is used to measure the supply of crossbred wool as it is assessed on a lot basis for sale. The weakness in this approach is that some 15% of the clip is assessed as being sold outside of the auction system (this is the gap between auction volumes and AWTA core test data on average) and it is safe to assume a lot of the wool sold privately is lower value wool which would include a high proportion of crossbred wool.
With the above caveat in mind Figure 1 shows annual sales of Australian wool broken into proportions for merino, superfine (a subjectively assessed merino), downs and crossbred. There are some “roughies” not included here (the runs with categories) and they explain the odd gap where the sum of the four categories does not reach 100% of the clip. Figure 1 shows a clear trend downwards in merino and corresponding rise in crossbred proportions of the clip from the mid-1990s through to 2011 to 2012. Since then the proportions have been fairly stable, with a variation of 1-2% between seasons. From an auction perspective the proportion of crossbred wool in the Australian clip has been stable during the past decade.
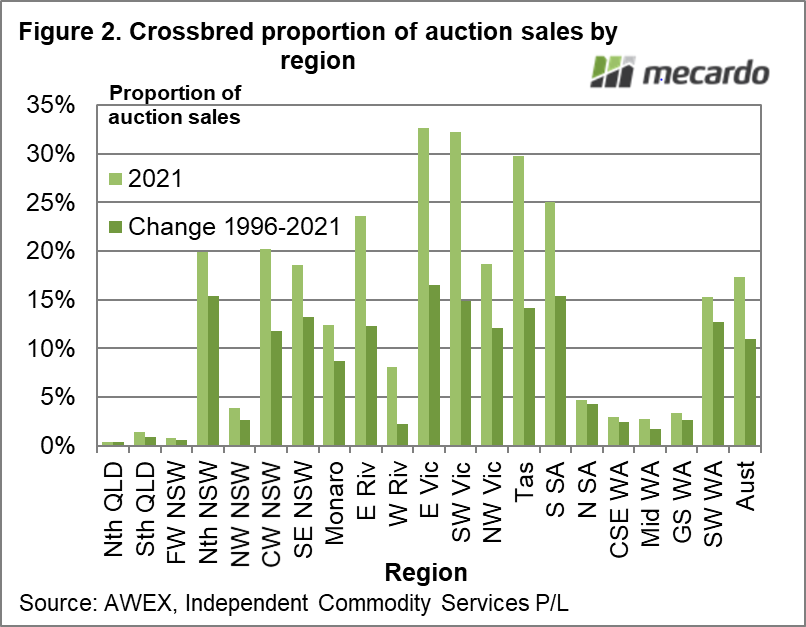
Averages can hide a wide range of varying values. Figure 2 shows the proportion of crossbred wool sold last season by region, along with the change in the proportion of crossbred wool sales from the mid-1990s to last season. Southern Victoria, Tasmania and South-East South Australia have the highest proportions of crossbred wool in their clips (ranging from 25% to 33% on a clean basis). The proportion of crossbred wool has increased in these regions by 15% since the mid-1990s, as it has for northern NSW (which includes the New England). Western Australia (except the south west) and the eastern pastoral regions all have low proportions of crossbred wool. In between, with 10% to 20% of their clips selling as crossbred are a range of regions.
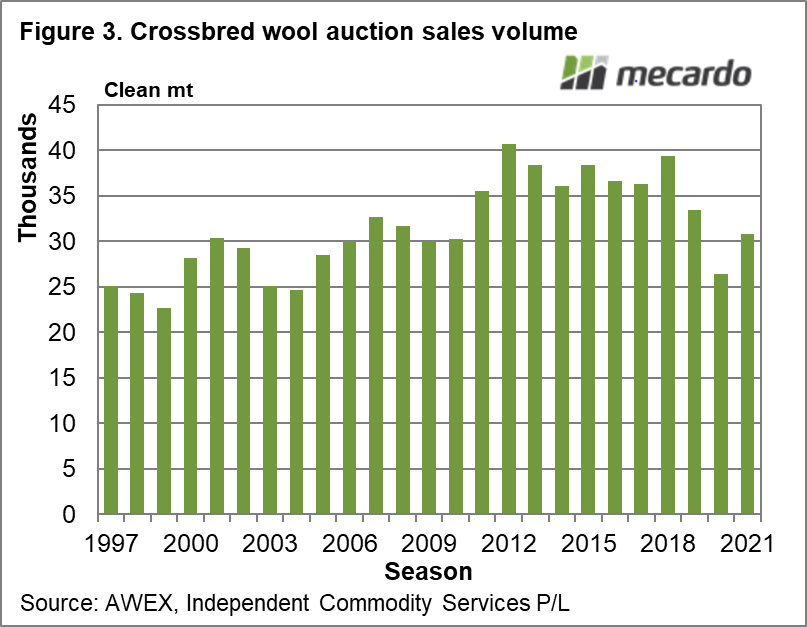
Figure 3 shows the actual total crossbred clip in clean terms by season from the mid-1990s to last season. In 2012 the crossbred volume stabilised and then held steady through to 2018 and 2019. Low prices in recent years probably account for the recent drop in volume, so it seems fair to think the supply of crossbred wool remains at levels similar to the past decade.
The MLA/AWI sheep survey shows the proportion of merino ewes in the ewe flock to be relatively stable, which supports the view drawn from the wool auction sales data. The MLA/AWI survey data does show change in the sense that the proportion of first cross ewes has fallen, with its place taken by composite ewes.

What does it mean?
There was a question posed to the recent AWI webinar which asked about work done for crossbred wool demand in light of the rising supply of crossbred wool. While a legitimate question, the reference to a rising supply was mistaken, which is a good thing as the last thing the crossbred wool market needs at present is increasing structural supply.
Have any questions or comments?

Key Points
- The proportion of crossbred wool in the Australian clip stopped rising around a decade ago.
- When looked at by region, the proportion of crossbred wool varies greatly, with south Victoria, south east South Australia and Tasmania having the highest proportions.
- The proportion of merino ewes, as measured by the MLA/AWI survey, has been steady and fits with the stability of crossbred wool supply.

Click on figure to expand
Click on figure to expand
Click on figure to expand
Data sources: AWEX, MLA/AWI, ICS, Mecardo