All markets are governed by supply and demand. Lamb markets are no different, and we have historically seen a very good relationship between supply and price, which gives a measure of demand. Some updated analysis on this suggests demand might up this year.
Long-time
readers will have seen our demand curve charts before. The demand curve is something you find in
secondary school economics. We can
create a demand curve by plotting the two known factors in the market, those
being supply and price.
For supply,
we use annual Australian lamb slaughter.
For price, we use the annual average Eastern States Trade Lamb Indicator
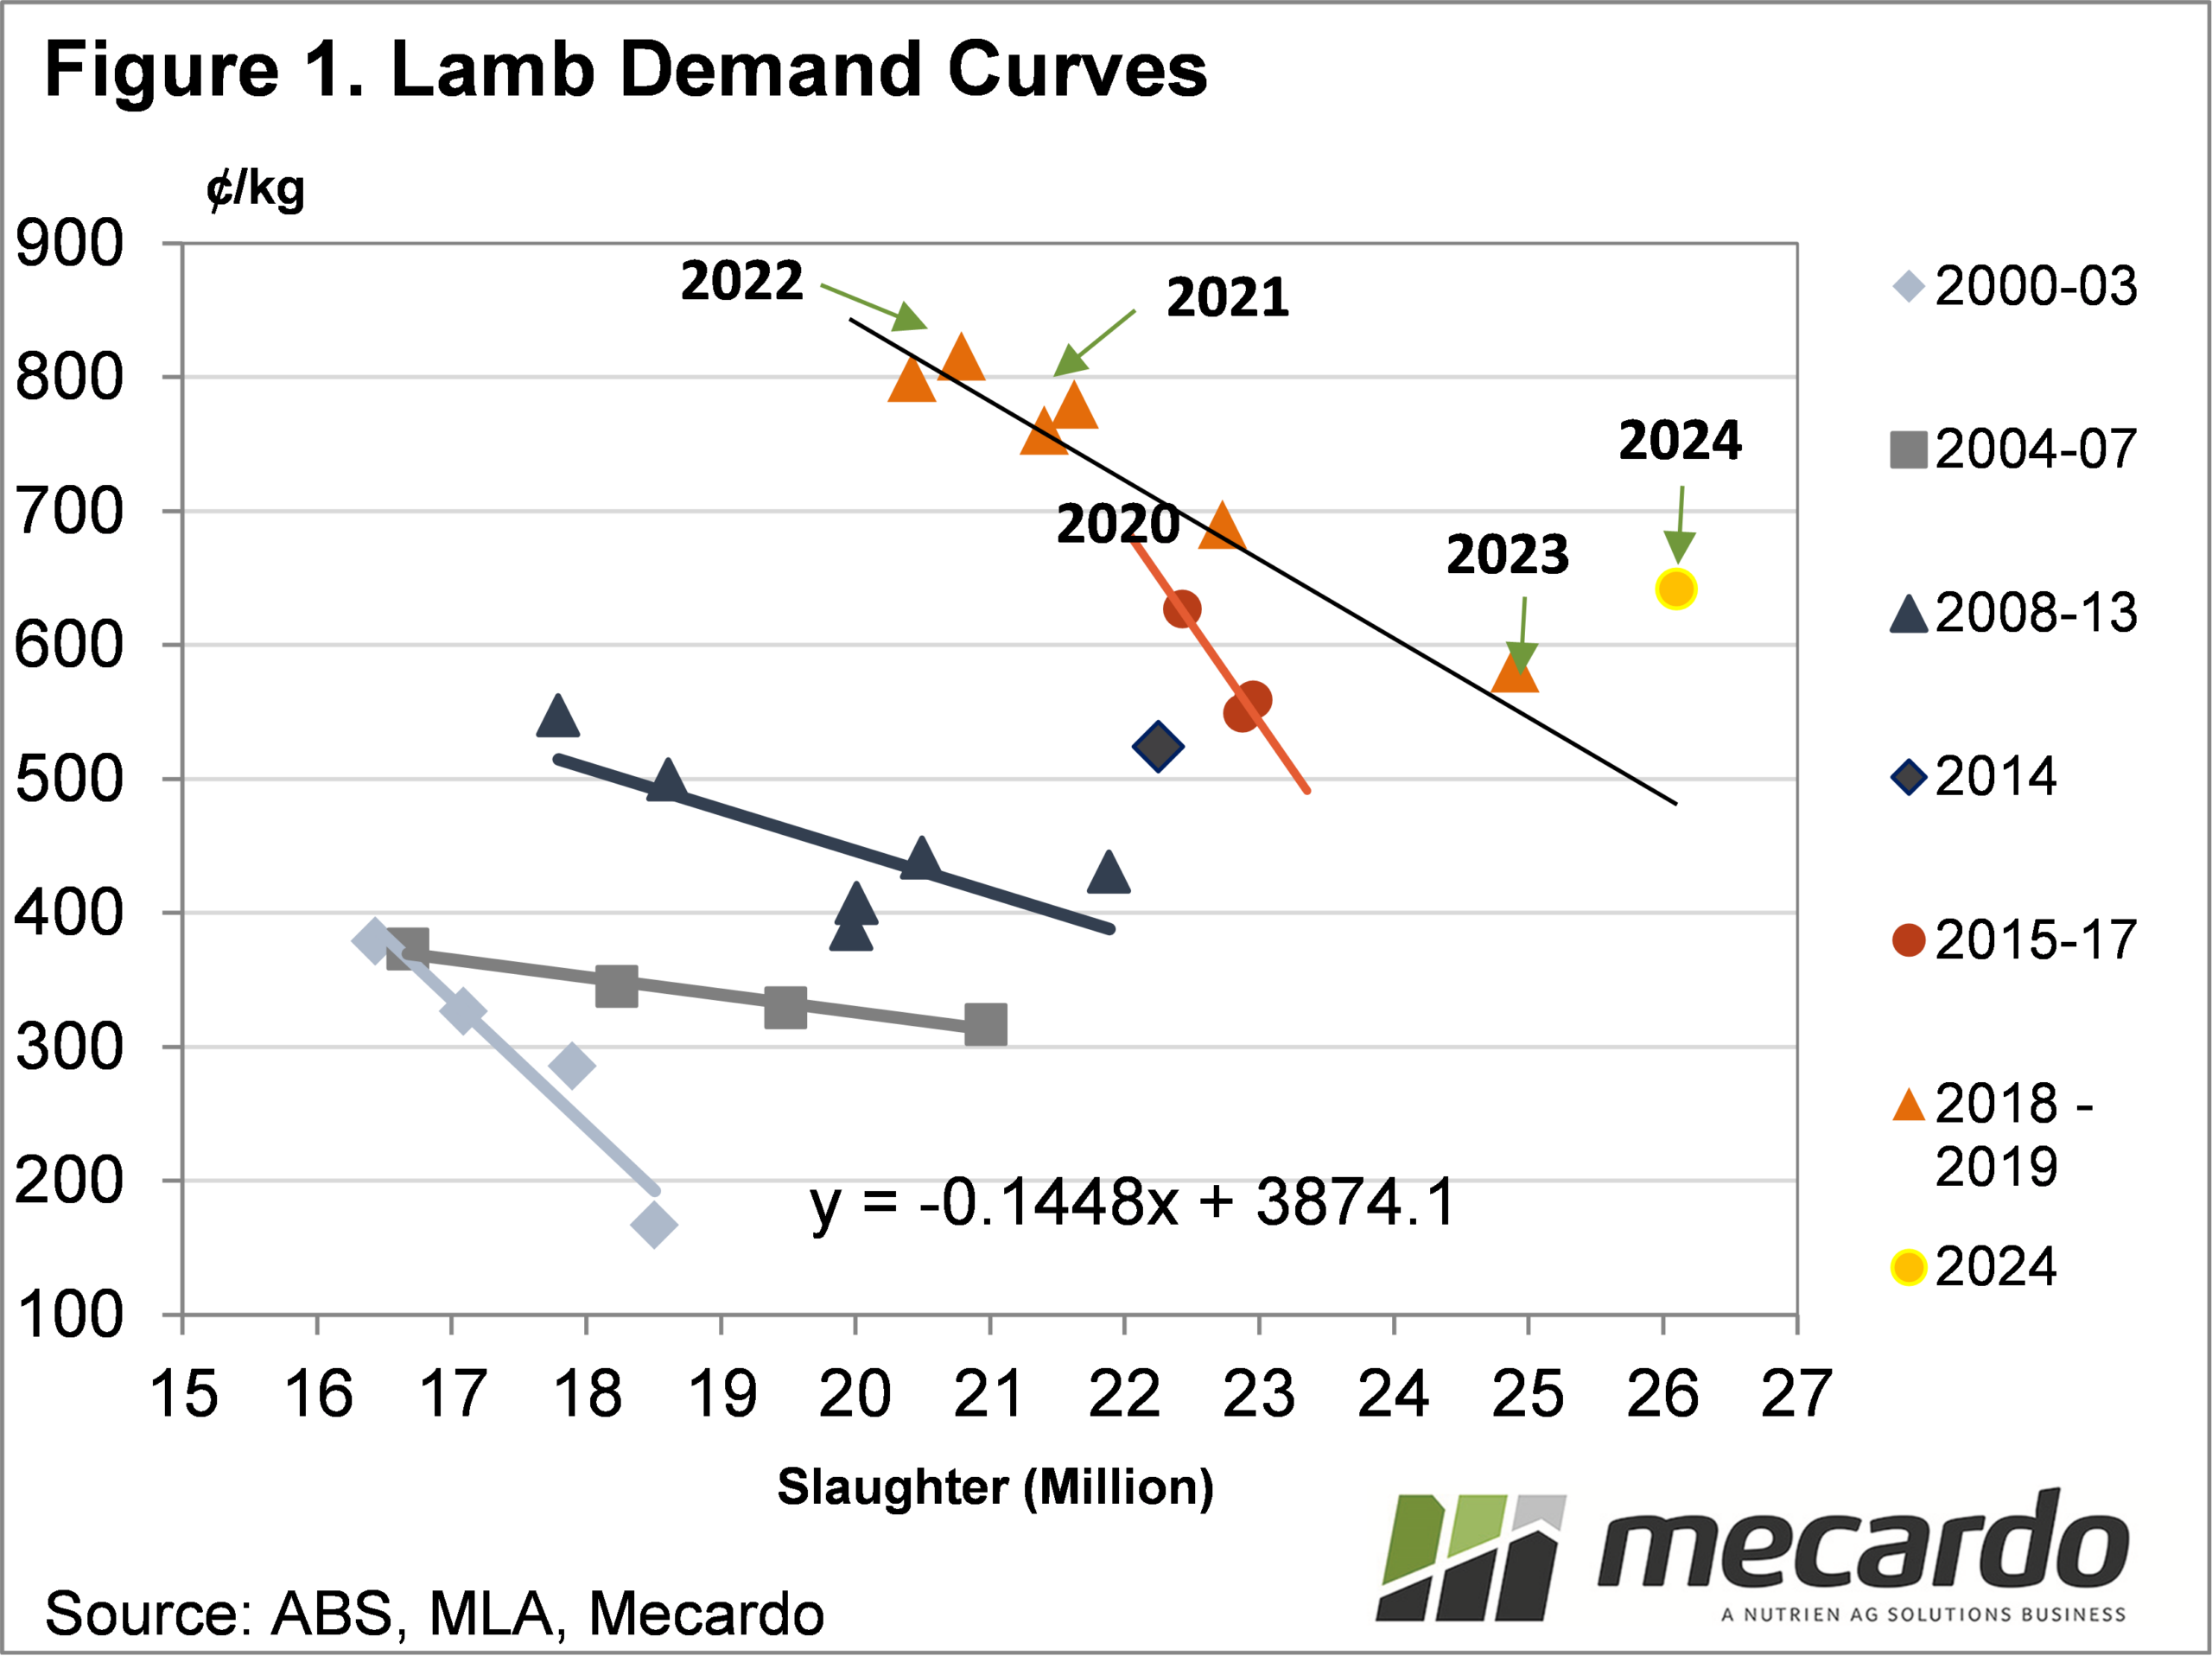
(ESTLI). Figure 1 shows some nice demand
curves we have seen over the years.
When supply
increases, the price goes down, and vice versa. We’ve tracked the data back to
2000 and we can see that the market will remain on a similar demand curve for
4-6 years, before shifting higher. When
demand shifts higher, we see the curve move out, indicating that consumers are
willing to pay a higher price for the same amount of lamb.
For
example, in 2007 lamb slaughter of close to 21 million head saw an average
price of 317¢/kg cwt. A similar
slaughter level in 2021 saw a price of 816¢/kg cwt. The same level of supply with a much higher
price shows stronger demand.
With lamb
slaughter running at record levels so far in 2024, and prices at levels which
while not at the levels of recent years, are still at levels of years when
slaughter was 15-20% lower. Figure 1
shows where 2024 currently sits on the demand curve when we use year-to-date
prices and the Meat and Livestock Australia slaughter forecast of 26.1 million
head.
The point
is way off the demand curve we have seen since 2018, with more lambs being
consumed at a stronger price than in 2023.
If we use slaughter for the year to date and extrapolate out for an
annual figure, we get slaughter of 30 million head. This is way off the chart we’ve got here, but
it is an indication of the strengthening of demand.

What does it mean?
Stronger demand is good news for lamb producers. It means processors, and therefore, consumers are willing to pay more for the same amount of lamb. If we see any slowdown in lamb supply, like that forecast by MLA for the next two years, we’ll see stronger prices. The 25 million head forecast for 2025 would see an average ESTLI of around 750¢.
Have any questions or comments?
Key Points
- Record lamb slaughter has been met with prices similar to 2017-2018.
- Demand looks to have strengthened early in 2024, compared to the last six years.
- A shift to stronger demand is good for lamb prices moving forward.
Click on figure to expand
Data sources: ABS, MLA, Mecardo
