Last month Mecardo looked at the relative price levels for wool and lamb, concluding that more non-merino lambs are likely to be produced next year. This article takes a long term look at the key driver of lamb production in Australia.
Price is generally used as a proxy for profit, which is a function of price and productivity. It is not a perfect substitute but prices are generally readily available and easy to work with. Farmers change the allocation of resources in response to changing relative profitability, for which we generally use changing relative price. The longer a change persists for, the greater the likely change in allocation.
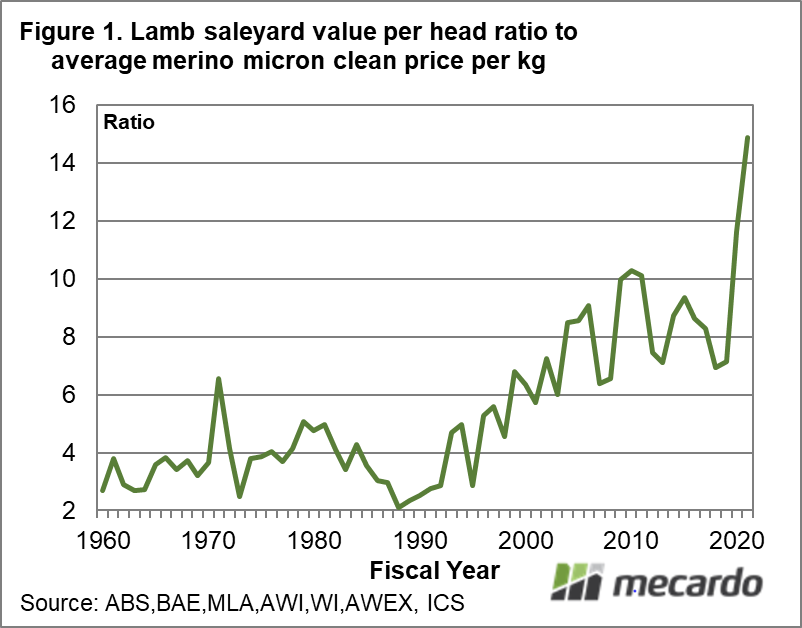
A simplistic measure of the profitability of lamb to wool enterprises is a simple ratio of lamb to wool prices. Figure 1 is an example of such a comparison. It shows the price ratio for the saleyard value of a lamb (price by weight) to the clean price for a kilogram of the average merino micron by fiscal year from 1960 to the current season (to date). It shows the price ratio varying between two and six in the four decades to 2000. In November 2017 Mecardo showed how the falling international supply of lamb (despite the efforts of Australian farmers) correlated strongly with the rising price of lamb.
In Figure 2 the series shown in Figure 1 has been smoothed (a rolling three year average) and then lagged by 2 years. Overlaid is the Australian lamb offtake (the number of lambs sold to abattoirs during the season expressed as a proportion of the flock size). The two series correlate nicely, with the lamb offtake following the lead of the lamb to wool price relativities.
The lamb to wool price relativity peaked at 10 in 2014 and since then has drifted along between eight and ten. The lamb offtake has similarly stabilised around 32% since 2016. In 2020 the significantly lower wool price has pushed the lamb to wool price ratio up to 14, with the rolling and lagged average price ratio rising to 11 in two years’ time. Substituting the current merino price for the average of the past decade (1550 instead of 1175 cents) lowers the rolling lamb to wool price ratio average to around 10, which is still near its upper limit of the past decade. This will be a test to see if the 32% lamb offtake (give or take a percent or two) is a structural feature of the Australian flock or a mere stepping stone to a higher lamb offtake.
What does it mean?
Seasonal conditions allowing, it looks as though the supply of lamb flowing to abattoirs will increase during the next couple of years. How that effects price will be largely dependent on international lamb production levels. It points to a slower rebuild of the flock as less young sheep are held back as might be expected, and points to continued constraints on merino wool production.
Have any questions or comments?
Key Points
- A simple lamb value to wool price ratio, smoothed and lagged, does a good job in explaining the structural change seen in the lamb offtake since the 1990s.
- The lamb to wool ratio has steadied in the past decade, with the lamb offtake steadying during the past six years.
- The lamb to wool price ratio is pushing to new, higher levels which points to an increase in the lamb turn off during the next couple of years.
Click on graph to expand
Click on graph to expand
Data sources: ABS, BAE, MLA, AWI, WI, AWEX, ICS , Mecardo


