Some requests have been made to Mecardo to look at merino micron premiums and discounts, which we will do in a number of articles. By using merino average prices the analysis is extended beyond the range of official wool indicators.
The relative prices of micron categories in the greasy wool market have varied widely in the forty years since the modern market came into being in the 1980s on the back of the demand for lighter weight fabrics which was facilitated by objective measurement and containerisation. Supply in Australia began to adjust to these new signals in the 1990s following the collapse of the Reserve Price Scheme with a major reduction in the production of, what is now, broad merino wool and an increase in finer merino production. In addition to these trends, seasonal conditions can whipsaw the merino micron distribution with some large effects on the volume of micron categories towards the edge of the distribution, both fine and broad. These trends and seasonal influences combine with fashion and economic cycles to produce volatility in the relative prices of different micron categories.
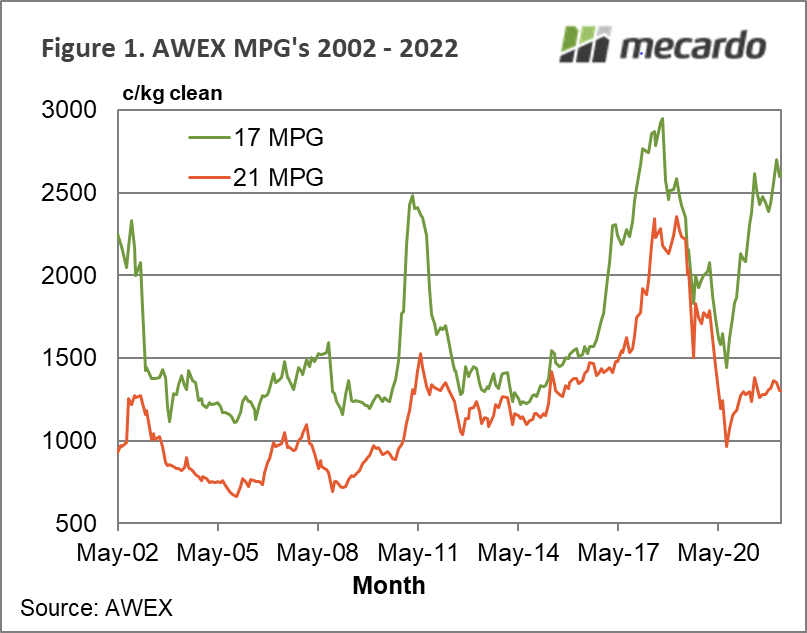
Figure 1 shows the eastern AWEX 17 and 21 MPGs for the past two decades. During the past decade these two categories have been around 2 microns either side of the average merino fibre diameter so they are a good guide to the volatility in micron category price differences. The schematic illustrates the wide range of price differences (from minimal to the current extremely wide) between the two MPGs in recent decades.
For the purposes of calculating percentile tables for the price differences between micron categories we switch to using price data developed from an eastern average merino combing fleece prices series. This provides more data for the finer micron categories than is available from the official AWEX MPGs. As a guide the average merino combing price for 17 micron in the past decade has averaged (using monthly data) 98% of the 17 MPG and for 21 micron 99% of the 21 MPG.
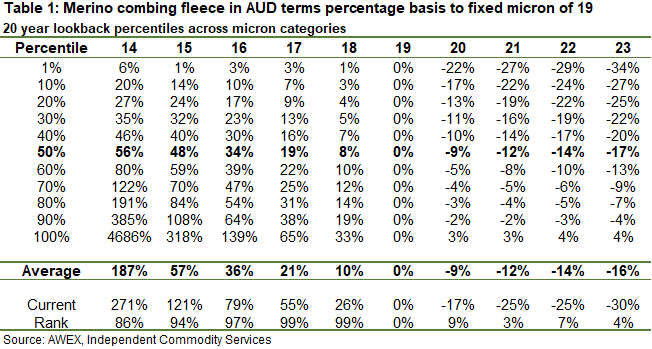
Table 1 provides the percentile breakup of eastern micron proportional basis to 19 micron for 14 through 23 micron, for the past two decades. In addition the average and current basis is shown, along with the current basis rank. Perceptive readers will note the minimum percentile is set at 1%, not 0%. This is done to chop out some noise in the data which come from using quite a wide average of wool types, in categories which can have very limited volumes at times. The current rank shows that fine micron premiums are near high extremes, while the basis for broader micron categories are near low extremes.
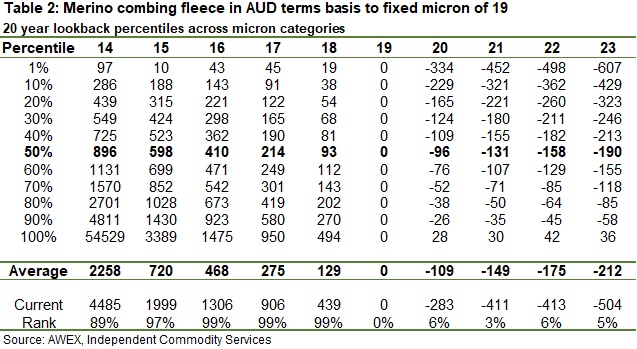
Table 2 repeats the outline of Table 1 but shows the basis in nominal clean cents per kg terms. It shows a similar message to Table 1 in that the current differences in price between the micron categories are extreme.
For anyone wanting to “look through” the price volatility of the micron premiums and discounts, the median (50%) levels in Tables1 and 2 show where the market has spent an equal time above and below during the past two decades.
What does it mean?
This article was designed to provide longer run micron premium and discounts for merino fleece, so that farmers could look at what sort of premium and discount is likely to be received in the future. It also shows that current premiums and discounts are at unsustainable levels.
Have any questions or comments?
Key Points
- Micron premiums and discounts are near their 20 year extremes in both percentage and clean cents per kg terms for merino fleece.
- The median level for both tables shows what is likely to be a more sustainable difference in price between the micron categories, which are much smaller than current levels (premiums and discounts).
Click on figure to expand
Click on figure to expand
Click on figure to expand
Data sources: AWEX, ICS, Mecardo


