In recent decades the prices of merino wool and lamb relative to their larger peer commodities have increased. Why this has happened is an interesting question from a range of perspectives. Marketers are generally quick to claim credit so these claims need to be tested and, with the collapse of crossbred wool prices in mind, understanding the foundations of higher relative prices helps with assessing longer term price risk. With this in mind, this article takes a preliminary look at changes in the Australian merino production since the collapse of the Reserve Price Scheme.
Figure 1 shows a volume series for merino wool from the early 1990s to last season, along with the average merino fibre diameter, annually. The story is well known, with both supply and fibre diameter falling significantly over time. This means both the volume and quality of the Australian merino clip has changed a lot in three decades. The merino volume is drawn from a mix of AWTA and auction data, and is a calculated number rather than a reported number. Wool volumes tend to be reported as totals without useful breakdowns by breed and micron category, hence the need to calculate the data rather than simply copy it from an annual report.
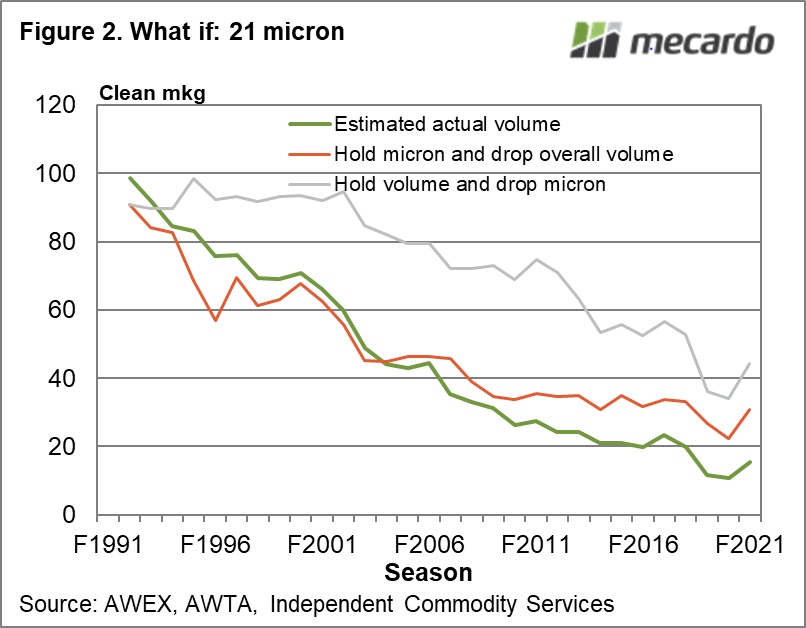
The original stimulus for the article was too look at how volumes had changed for major micron categories in order to investigate how this had affected the price of the category selected. To do this, some what if scenarios came to mind; what if the Australian merino clip had maintained its volume while reducing fibre diameter and what if the merino clip had maintained its fibre diameter while reducing volume. Figure 2 shows the first scenarios for the 21 micron category. In the late 1990s the average micron for the merino clip was 21 micron, it is now 19 micron. In Figure 2, the actual 21 micron volume (by season) is shown along with the two scenarios. In the hold the volume (at early 1990 levels) and drop the micron scenario, the supply of 21 micron wool would have been stable through the 1990s, then it would have started to fall. It would be around three times current levels – which would test price. In the hold the micron (at early 1990 levels) and drop the volume, the supply of 21 micron would have trended lower as it did but ended up with supply twice current levels.
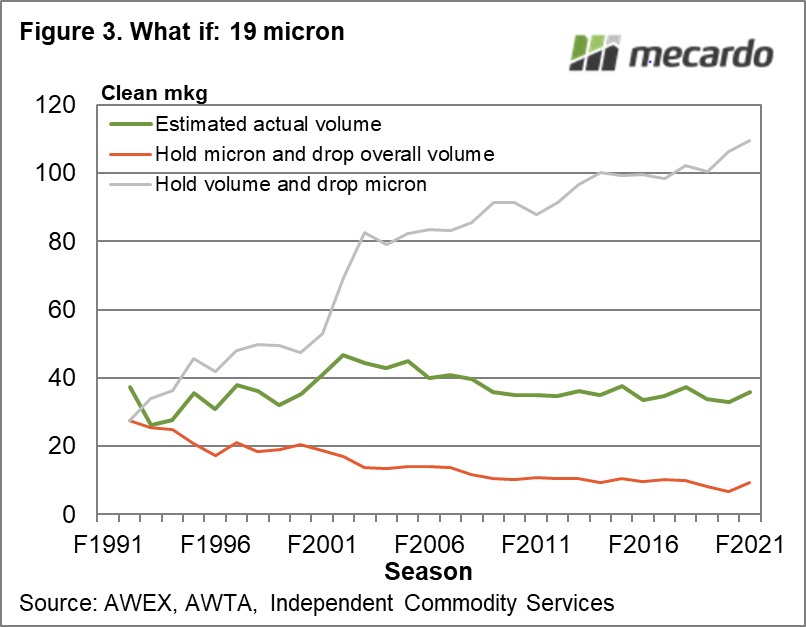
Figure 3 repeats the exercise for 19 micron. The actual volume has been fairly stable during the past decade. If the overall clip volume had remained at early 1990 levels and the micron had dropped, the supply of 19 micron wool would now be 250% of the current volume. On the other hand if the average micron of the merino clip had been held steady while volume dropped the supply of 19 micron would only be 20% of current levels.
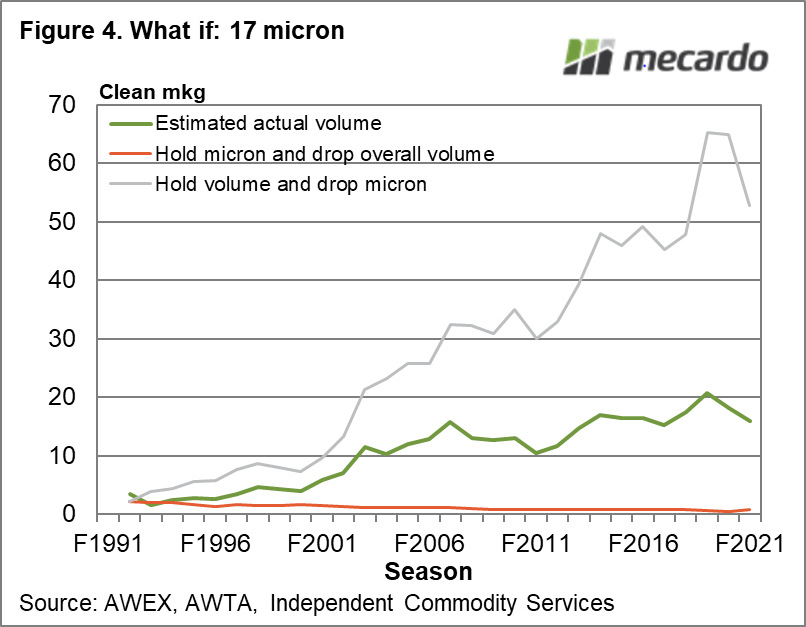
Finally Figure 4 looks at 17 micron. It is a similar story to the 19 micron, only more exaggerated. If the volume had been held (same sheep numbers as the early 1990s) and micron dropped, the supply of 17 micron would be 3-4 times higher. In the other scenario where the micron is held and volume dropped the supply of 17 micron would be irrelevant except to a small group of farmers and some specialist processors.

What does it mean?
The development of greasy wool prices is a complex mix of changing supply which feeds into changing relative prices (within the greasy wool market and between different fibres) and changing demand, both structural and cyclical. In the longer run lower supply of merino wool will help support higher prices relative to other fibres – something to look at in another article.
Have any questions or comments?
Key Points
- As usual with micron categories the further away from the average, the greater are the supply changes.
- The combination of overall volume and average micron changes in the Australian merino clip has had a big effect on all micron categories, the more so the further away from the average micron.
- These changes in supply in turn will have had a sizeable impact on the relative prices of the different micron categories – helping support higher prices for the broader micron categories and reducing micron premiums for the finer micron categories.

Click on figure to expand
Click on figure to expand
Click on figure to expand
Data sources: AWTA, AWEX, ICS , Mecardo
