
Fibre diameter is a major, if variable, driver of value in Merino wool prices. In turn, fibre diameter is responsive to changes in seasonal conditions, which means the supply of different micron categories varies with rainfall, feeding into the balance between supply and demand which determines price. This article takes a look at fibre diameter in the Australian wool clip.
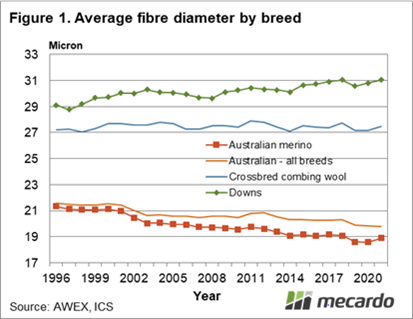
In the mid-1990s there was a small difference between the average fibre diameter of the Australian wool clip in total and the Australian Merino clip in the order of 0.3 micron. As the clip began to change structure (view previous article – structural change in the Australian Merino clip) in the early 2000’s, the gap between the total and Merino average fibre diameter widened. In the current market, the overall clip average fibre diameter (season to date) is 19.8 micron, while the Merino clip (season to date) has averaged 18.9 micron, nearly a full micron finer.
Figure 1 shows season average fibre diameter for the Australian wool clip, the Australian Merino clip, combing length crossbred wool and downs wool. Auction sales are used to generate these averages. The schematic illustrates the growing gap between the Merino and total clip micron (although this has steadied in recent years). The trend lower in the Merino fibre diameter has dragged the total clip fibre diameter lower, as the combing crossbred fibred diameter has remained steadily in the 27-27.5 micron range and the downs fibre diameter has trended higher.
Within the Merino clip there is a wide regional variation of fibre diameter. Figure 2 shows seasonal average (auction sales data once again) fibre diameter by state from the mid-1990s to the current season to date. NSW remains the major producer of wool in Australia, accounting for 36% of clean volume sold in the past year despite a severe drought. Merino fibre diameter has trended lower in all states, with South Australia remaining the broadest producer of Merino wool, followed by Queensland. Tasmania has consistently had the finest Merino clip.
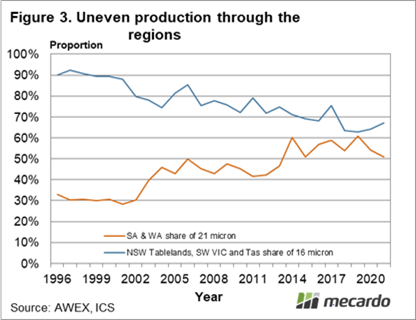
The varied average Merino fibre diameter between states (and regions) leads to some concentrations of the production of micron categories. Figure 3 shows a couple of samples of this concentration. It shows the proportion of 21 micron wool sold at auction by season which came from South Australia and Western Australia. Overall these two states account for one-third of Merino production, but for 21 micron they have accounted for 50% to 60% of supply since 2014. This means that changes in production in these states has an outsize effect on the supply of broader Merino wool.
At the other end of the micron distribution the proportion of 16 micron wool sold which came effectively from the NSW tablelands, south west Victoria and Tasmania is also shown in Figure 3. While this proportion has been falling (reflecting the falling importance of the New England as a source of fine wool) it still accounts for 60-70% of 16 micron supply, compared to the one-third of the total Merino clip these regions account for.

What does it mean?
Wool fibre diameter has a bell jar distribution around the average. This means a small difference in micron, such as the 1.2 micron difference (the average for the past decade) between the Merino and total Australian clip has big implications for the supply of wool towards the edge of the distribution, basically wool which is 2 microns or more away from the average. When talking supply we need to use the appropriate average and then consider the region of supply carefully.
Have any questions or comments?
Key Points
- Merino fibre diameter is unevenly spread between the different production regions.
- This uneven spread of production means that the supply of broad and fine Merino wool can be affected by seasonal conditions in a small number of regions.
- The states have maintained their relative differences in Merino micron during the past 25 years.
Click on figure to expand

Click on figure to expand
Click on figure to expand
Data sources: AWEX, ICS, Mecardo


