Premiums and discounts in the wool market are constantly on the move, responding to changes in supply and demand. The supply changes tend to be slower moving cycles based on a mix of seasonal conditions and farmer management. Supply has been strongly supportive of increased micron premiums and discounts during the past year. This article looks at where these premiums and discounts currently are.
Mecardo last looked at merino micron price curves in January, showing the relative outperformance of short-staple wool which is used for knitwear apparel. Also, in January, Mecardo looked at the relationship between supply and micron premiums and discounts, showing supply to be the key driver. AWTA volumes (view here), showed a continued rise in broad merino volumes and a continued fall in fine merino volumes. This means that supply will continue to support the current merino micron and premiums, especially given the size and spread of the autumn break which NSW (the major sheep province) has received in March.
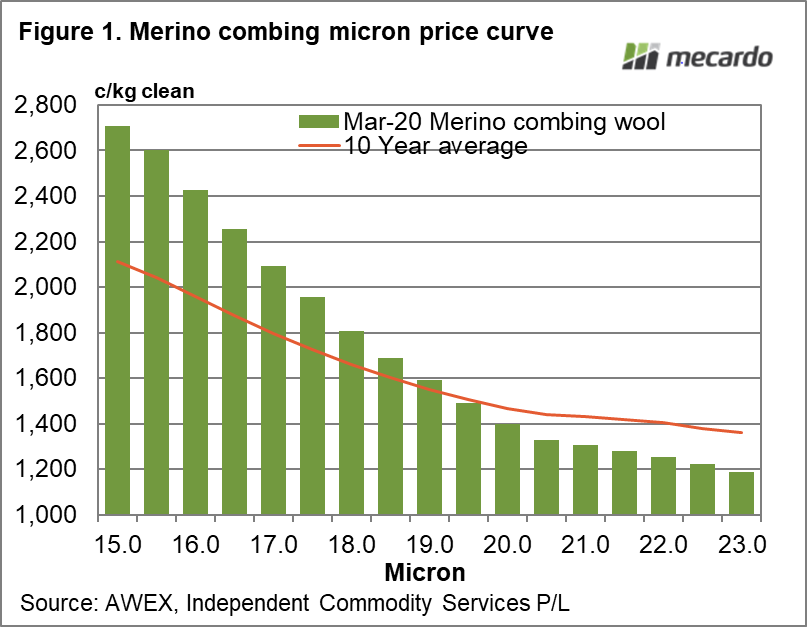
Figure 1 shows the average prices for combing merino fleece wool for March and for the past decade, from 15 to 23 micron. The range of wool caught by these averages is larger than the range used for AWEX MPGs, as it takes in a wider range of various wool characteristics – mainly being staple length and strength. It shows the 19.5 micron price for March to be around the average level for the past decade. March prices for wool finer than 19.5 micron are higher than the 10-year average and broader micron prices are below the 10-year average.
The second schematic in Figure 2 shows the micron premiums and discounts for the series shown in Figure 1, based on 19.5 micron which is set to equal zero. It is no surprise that the March 2021 premiums and discounts exceeded the 10-year averages, as a rule, being double the average.
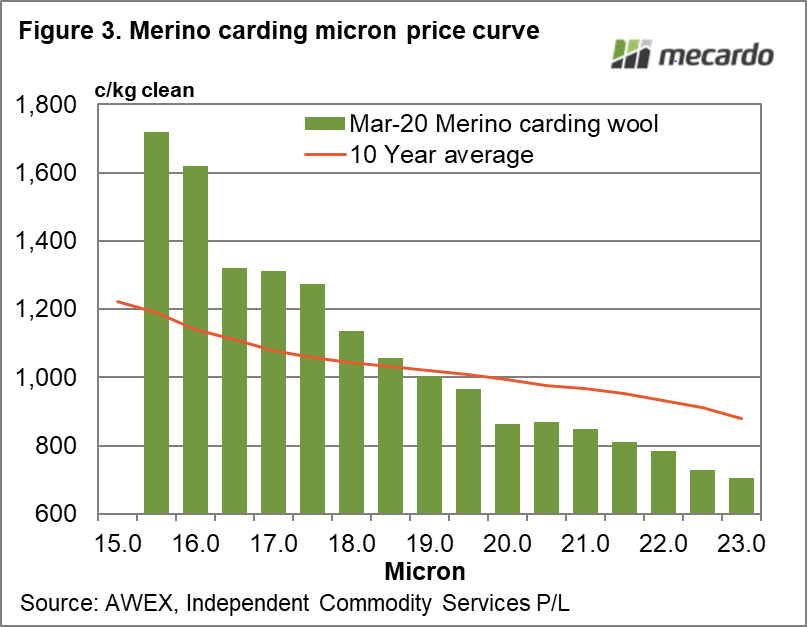
Figure 3 repeats the form of analysis shown in Figure 1 for a merino carding price series – which is an average of merino locks and crutchings. Like combing wool, the fine carding prices are well above their 10-year averages and the broader prices are well below the 10-year averages.
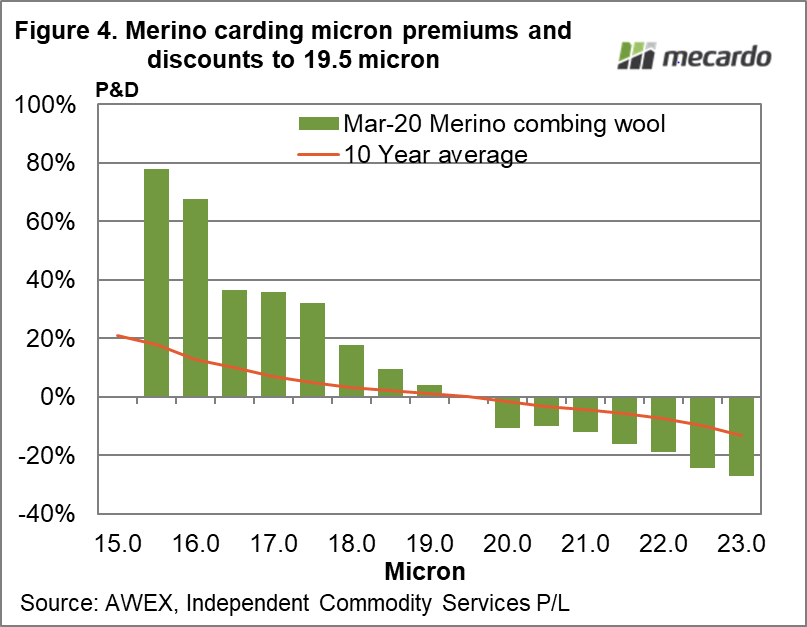
Figure 4 shows the micron premiums and discounts for merino cardings, based around 19.5 micron. In this case the fine micron premiums are 3.5 to 6.5 times the 10-year average, while the discounts are 2.5 to 3 times the 10-year averages. It shows the extreme nature of the cardings micron price curve in relation to historical patterns.

What does it mean?
Supply is the key driver of change in micron premiums and discounts, with resistance from the buy side (demand) acting as a limit to how far these premiums and discounts can push. Given recent rainfall, it seems that supply will remain supportive of the micron premiums and discounts currently seen in the market for longer than earlier expected, most likely, well into next season.
Have any questions or comments?
Key Points
- The merino cardings micron price curve is the real star of the current cycle for increased micron premiums and discounts.
- The micron price curves (both combing and carding) remain well beyond the levels of 10-year averages.
- Supply trends that caused these micron price curves, are likely to persist well into next season, thanks to the recent rainfall in March across NSW.
Click on figure to expand

Click on figure to expand
Click on figure to expand
Click on figure to expand
Data sources: AWEX, ICS , Mecardo
