
A Mecardo reader recently requested some information on proportional micron premiums and discounts, so this article takes a look at ten year percentiles for micron premiums and discounts running from 15 through to 23 micron.
A key decision to make when using percentiles (deciles) is the length of time from which to draw data (the lookback period). There is no set rule for determining what lookback period is appropriate. It is a balance between having enough data to capture, in this case, a range of markets when micron premiums and discounts were both wide and narrow while seeking to avoid including data from markets where major structural changes have taken place. For the latter point, the fine wool market in the 1999-2001 period produced massive micron premiums in part because of a limited supply of fine wool merino wool. Supply of fine wool has since expanded while the supply of broad merino wool has collapsed (view ‘structural change in merino clip’ article). For this article a lookback period of 15 years has been selected.
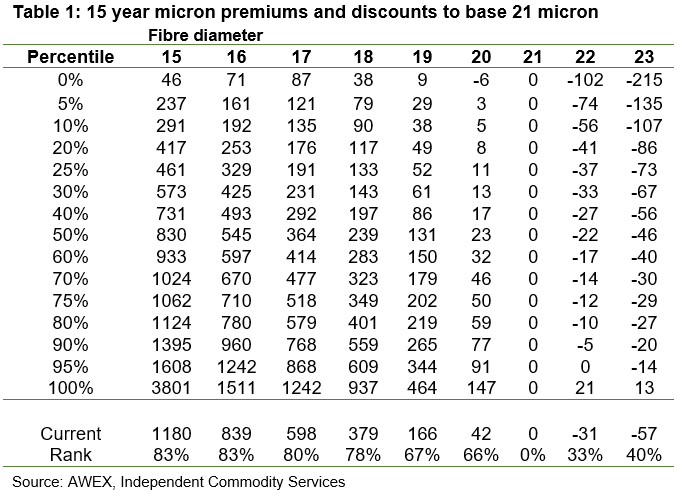
In Table 1 a percentile breakup of micron premiums and discounts, to a base price of 21 micron, from the past 15 years is shown. The current level is the October 2020 average. AWEX MPGs have been used for 17 to 23 micron. For 15 and 16 micron eastern Australian auction prices for merino fleece with a staple length of 70-85mm, a staple strength around 35 N/ktx, vegetable fault below 1.8% and no subjective faults has been used. The 21 micron category is used as the base price, although it is now a full standard deviation broader than the average merino fibre diameter, which means it now resides near the broader edge of the merino fibre distribution with only around 16% of the merino clip in broader micron categories.
Fine micron premiums are high by the standards of the past 15 years. The 15 micron premium, at 1180 cents, has traded at a lower level for 83% of the past 15 years.
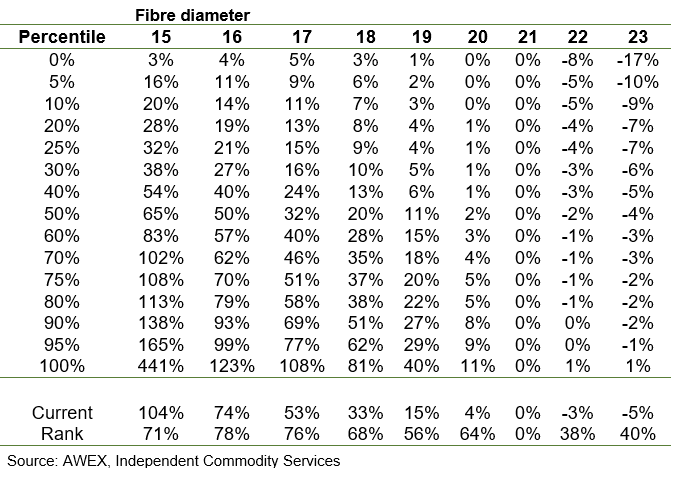
Table 2 shows a similar analysis except the premiums and discounts are proportional. This method helps to remove the effect of price level on the premiums and discounts, focussing on the relative values. By this method the fine micron premiums are not as highly ranked as the absolute premiums shown in Table 1. The 104% premium of the 15 micron category to the 21 micron price has been lower for 71% of the past 15 years, conversely it has been higher for 29% of the past 15 years.

What does it mean?
Micron premiums and discounts are usually in flux, changing in a cyclical fashion which is often driven by changes in supply. Percentile analysis helps to sort through the varying levels to identify the median level of these premiums and discounts which can then be used in breeding decisions.
Have any questions or comments?
Key Points
- Fine micron premiums are pushing up to high percentile rankings (on a 15 year lookback) in absolute (c/kg terms).
- In proportional terms fine micron premium rankings are not quite as high, with the rankings of 19 and 20 micron premiums to 21 micron appreciably lower.
- Conversely broader micron discounts have lower rankings, but are still in the 30th to 40th percentile range.
Click on table to expand
Click on table to expand
Data sources: AWEX, ICS, Mecardo


