Change in supply does not explain all of the changes seen in micron premiums and discounts, but it does explain a lot of it. The interesting thing about that is we have good data on supply therefore we have a good view on the key driver of the micron price curve. This article takes a look at the relationship between supply and price for Merino wool by fibre diameter.
In this article the change in supply used is the change in the rolling 12 month total volume for AWTA core test data, as a rough approximation of how the supply chain views the supply of raw wool. The change in premiums and discounts are based on monthly data and are simply year on year changes.
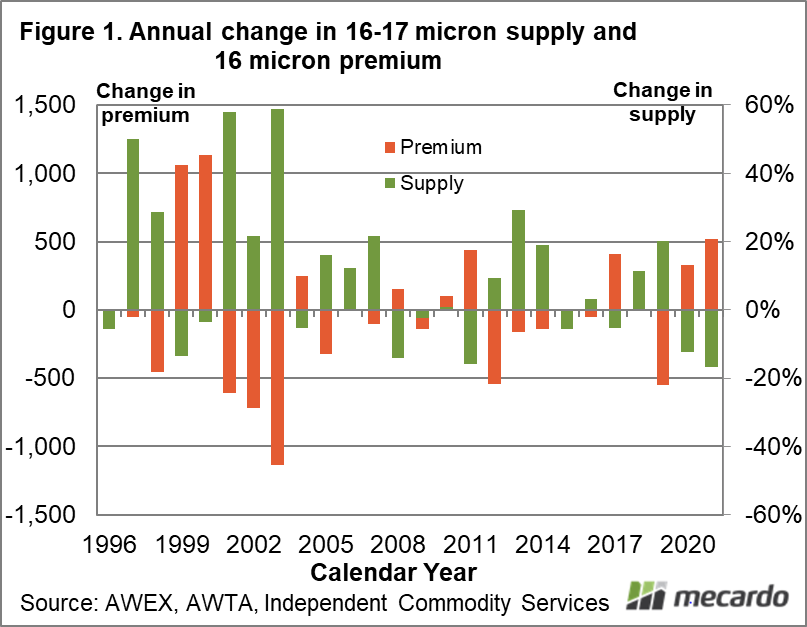
In Figure 1 the annual (calendar year) proportional change in supply for 16-17 micron AWTA core test volumes (right hand scale) is compared to the year on year change in the 16 micron premium in cents per clean kg to the average merino micron category (left hand scale).
The schematic in Figure 1 shows how supply and the premium move in opposite directions (they are negatively correlated) so rising supply usually sees a falling premium. In 2020 and 2021 the supply fell with the premium consequently rising. Using a basic linear regression the change in supply in Figure 1 explains half of the change in premium.
Figure 2 looks at the relationship between supply and price on the other side of the merino micron distribution. It compares change in the supply of 21-23 micron wool with change in the 23 MPG discount to the 20 MPG. The discount has been called the spread in the graphic as the negative change signifies the spread widening (discount increasing). As with Figure 1, in Figure 2 the change in supply explains half of the change in discount for the broader merino micron category.
The 28% increase in 21-23 micron volumes seen in 2021 (to August) is the biggest rise in broad merino volumes in Figure 1, which begins in the mid-1990s. It has been a long three decades of falling broad merino supply in Australia.
The import of the schematics in the article is that they show change in supply accounts for half of the change in merino micron premiums and discounts. That leaves plenty of room for fashion and economic factors to have an influence on the relative price for the different merino micron categories. Change in the supply of different micron categories is constant as it is driven by change in seasonal conditions. As supply varies from year to year, so the greasy wool market structure varies. Recent extreme discounts for vegetable matter are another good example of this process in action.

What does it mean?
Don’t expect micron premiums and discounts to settle at a level, as continually varying supply fuels a constantly adjusting market structure. Since the recovery from drought in eastern Australia which began in early 2020, the merino fibre diameter has swung broader which has pulled fine merino volumes lower and pushed broad merino volumes up with consequent impacts on the merino micron curve. That cycle is now starting to deaccelerate, which has been expected.
Have any questions or comments?
Key Points
- Change in supply accounts for half of the year on year variation seen in merino micron premiums and discounts.
- As supply depends on variable seasonal conditions, the market is forever fine tuning merino microns and premiums in response to changing supply.
- The supply of 21-23 micron wool is enjoying its strongest growth in three decades in 2021, driving the wide discounts seen for broader merino micron categories.
Click to expand

Click to expand
Data sources: AWEX, AWTA, ICS
