Australian beef faces stiff competition in our key export markets from both their domestic herds and from other exporting countries. Today we have a look at the size and structure of the herds that exist in the Americas, namely the US, Canada and Mexico.
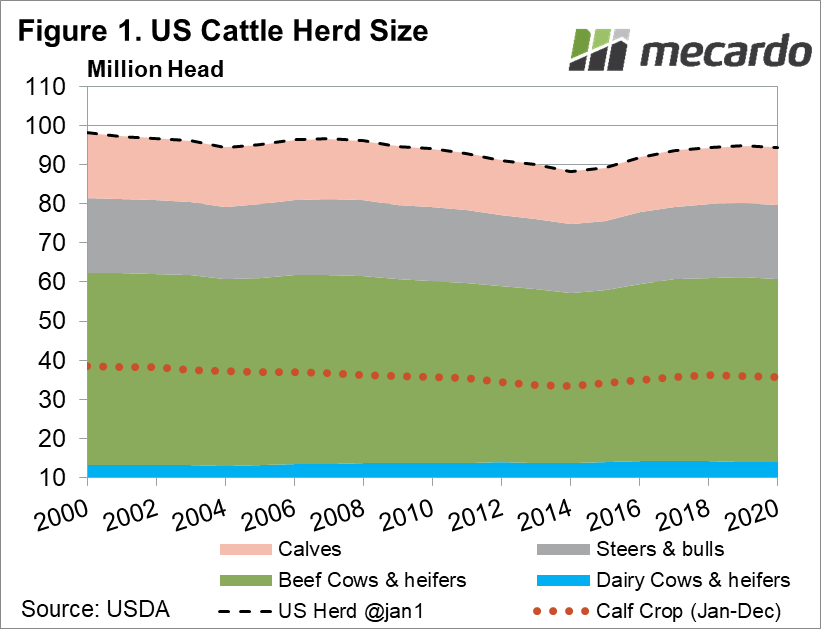
USDA data indicates that in 2020, the opening US cattle herd, including calves stood at 94.4 million head (figure 1), close to four times Australia’s 26 million head. The US herd exhibited a minor decline from 2019, coming off a stronger rebuild phase that started in 2015 triggered mostly off the back of good seasonal conditions. Around 6 million head have been added over 5 years. Of this number however, more than a third are calves, bulls and steers as opposed to female breeding stock of around 61 million.
The structure of breeding cows and heifers within the US herd is dominated by beef cattle, with dairy cows and heifers only accounting for around 14 million head, compared to beef, which stands at an estimated 47 million.
Over the last 20 years, the US dairy herd has remained relatively stable, growing less than 6% since the year 2000. In contrast, the female beef cattle population has shrunk moderately by 2%, though a rebuild is evident over recent years from lows of 43 million observed in 2014 to current levels. The US calf crop has, however, shrunk from 38.5 million back in 2000, to only around an estimated 36 million head currently.
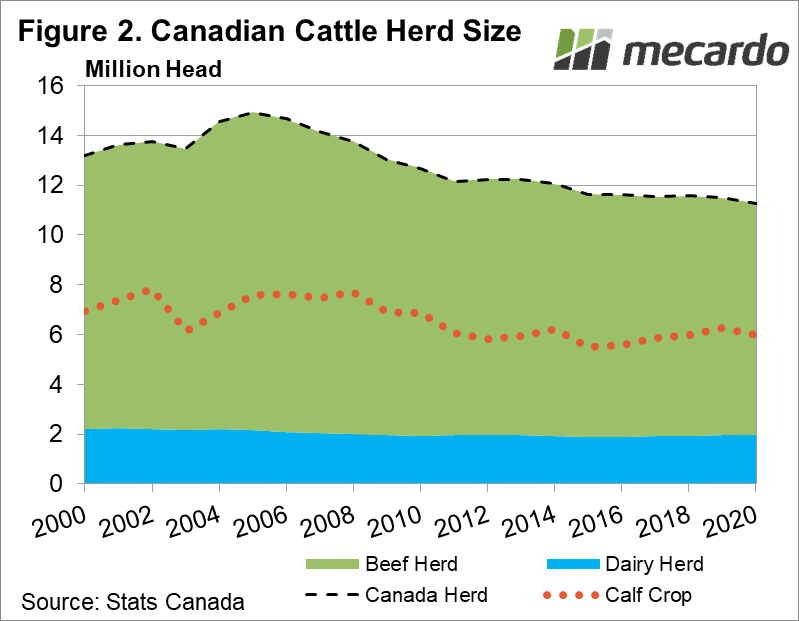
Moving to the Canadian situation, (figure 2), Canada’s herd stands at around 11.3 million head. It has been declining for a number of years now, with recent history indicating that the cattle population peaked in 2006 at 15 million head. The Canadian cattle industry has shrunk close to 25% in the last 14 years. Consequently, production, represented by the calf crop has also slipped from it’s high of 7.5 million head to only around 6 million head.
The Canadian Cattlemen’s Association has commented that the decline was being driven by a decay in the profitability of Canadian cattle enterprises, partly due to an increasing trend of more variable, dry and unpredictable weather conditions, which is the opposite to the general US situation.
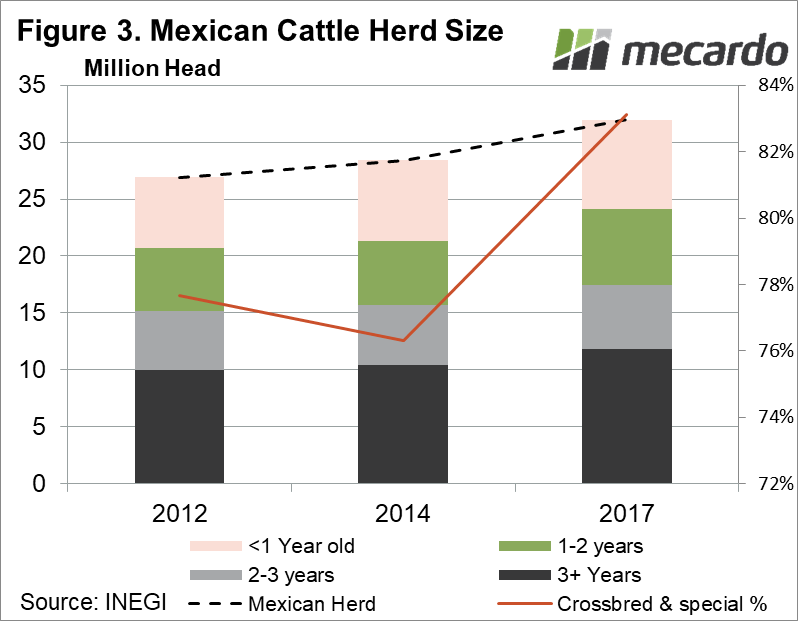
The data available on the Mexican herd (figure 3) shows that the herd has grown 15% from 2012-2017, to 32 million head in 2017. As we discussed in a previous article, Mexico’s exports into the US have exploded recently, suggesting that the herd rebuild and increase in productive capacity occurring there is likely to have continued. The cattle population has also been moving away from the traditional lighter, Corriente and Criolla cattle, into heavier crossbred and specialized breeds more suited to international preferences, which are now making up 83% of the herd at last count.
What does it mean?
The US cattle herd is relatively stable, while cattle numbers are experiencing a decline in Canada. However, data available on the Mexican herd has been showing a trend of expansion and change in breed – it’s exports are rocketing into one of Australia’s most important export markets; the US. With world animal protein prices picking up recently due to shortages driven by African Swine Fever, Canadian producers may be looking to rebuild.
Have any questions or comments?
Key Points
- The US herd at 94 million head is massive compared to Australia’s 26 million, but so is US domestic consumption.
- The Canadian herd, is 11.3 million, and is in decline, losing 25% from its peak
- Data on the Mexican herd suggests a rebuild.
Click on graph to expand
Click on graph to expand
Data sources: MLA, USDA, Stats Canada, Mecardo


