New Zealand is the other major sheepmeat exporter in the world and is the major carpet wool producer, so the New Zealand sheep flock is of interest to the Australian sheep and wool industry. It can also be insightful to see how farmers in other countries are responding to world prices for agricultural commodities. This article takes a look at offtake levels in the New Zealand sheep flock and changes in the New Zealand flock size.
In Figure 1 the rolling 12 month adult sheep offtake is shown (right hand axis) for the New Zealand sheep flock, from the mid-1980s to April. Shaded areas on the graph are where the adult offtake is above 12%, and the New Zealand flock size is overlaid (left hand axis). The relationship between the adult sheep offtake and changes in flock size is not as tidy as for the Australian flock but is a reasonable indicator of the pressures on the flock in New Zealand. 2012 was the last time the sheep offtake fell below 12%. Since then the New Zealand flock has shrunk by around 13% (27 million) although it has shrunk only marginally since 2016.
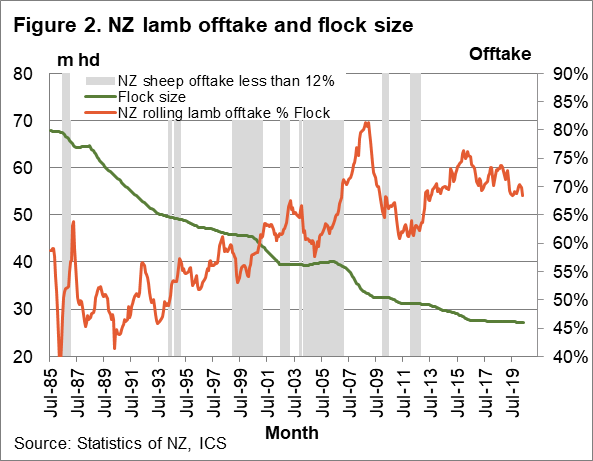
In Figure 2 the lamb offtake for the New Zealand flock is shown for the same period as in Figure 1. Like the Australian lamb offtake, the New Zealand lamb offtake has risen during the past 25 years, although to higher levels. Since 2013 the lamb offtake has stabilised around 70-75% in New Zealand. Given that the flock size has been reasonably stable in recent years, it seems New Zealand farmers can turn off lambs equivalent to 70-75% of the flock size sustainably. In 2008 the lamb offtake rose above 80%, with the sheep offtake coincidentally rising above 20% and as a consequence, the flock size shrank by 20% in two years.
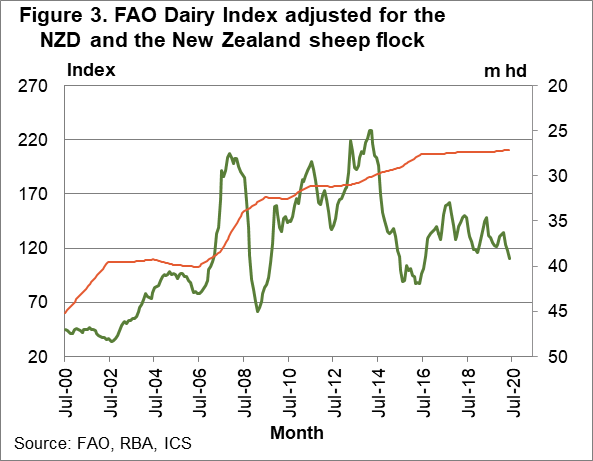
In October 2016 Mecardo looked at major stock numbers in New Zealand, showing how dairy cow numbers had risen strongly from the late 1990s at the expense of both sheep and beef cattle numbers. In Figure 3 the FAO Dairy Index (adjusted for the NZ dollar) is shown from the year 2000 onwards, with the sheep flock size overlaid (right hand axis with values reversed). As the dairy index trended higher from 2002 onwards, the sheep flock trended lower. Since 2015 the dairy index has stabilised, after falling heavily from peak levels in 2014, and the sheep flock seems to have stabilised.
What does it mean?
Droughts aside, the stability seen in the New Zealand flock in recent years matches the general trend seen in the past decade in both Australia and South Africa. In New Zealand, the dairy industry is an important competitor for farm resources. The relative decline in dairy prices after 2014, looks to have taken some of the pressure off the New Zealand sheep flock. In the longer term picture, it is a good thing to have a stable flock in New Zealand as an industry can’t shrink itself to a profitable future.
Have any questions or comments?
Key Points
- The New Zealand flock looks to have stabilised since 2016, at around 27 million sheep.
- The adult sheep offtake has fallen to be close to neutral levels during the past 18 months and the lamb offtake looks to have settled at a sustainable level.
- The FAO Dairy Index has settled at a lower level in the past five years, compared to the preceding decade. Lower dairy prices point to less pressure on sheep numbers which helps explain the stability in the flock size.
Click on graph to expand
Click on graph to expand
Click on graph to expand
Data sources: Statistics of NZ, FAO, RBA, ICS


