A request for Mecardo to look at wool production in central west Queensland has prompted this article and a follow up one to come later in the week. Queensland as a whole generally accounted for 10% of the Australian sheep flock through to the mid-1990s, when a decline relative to the national flock began, stabilising around 3% in 2014. This article looks at northern Queensland wool supply and price relative to the rest of Australia generally.
The request was for an article focussing on wool production out of central west Queensland, best described in wool statistical areas, as encompassing Q12, Q14, Q15 and Q17, roughly defined as country north of a line running from Rockhampton south west through Tambo. A look at 2019-2020 sales show that these four regions accounted for 85% of northern Queensland sales by clean volume, and given the northern Queensland data is ready to hand the analysis for the article uses northern Queensland data.
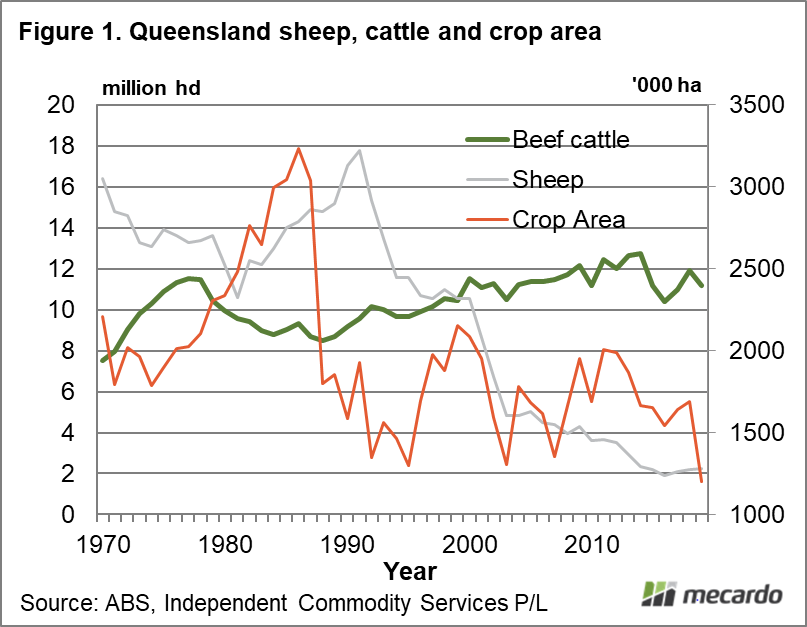
To give some background perspective, ABS annual data for Queensland beef cattle, sheep and crop area numbers from 1970 through to 2019 is shown in Figure 1. It shows sheep numbers peaking around 1990 at 18 million and the trend all the way down to 2 million by 2014, while beef cattle numbers rise by around 4 million (more than enough to account for the drop in sheep numbers) and a highly variable crop area.
Figure 2 shows the annual volume of clean wool sold from North Queensland, which references the left-hand scale and the proportion of the national wool clip sold (right-hand scale). In the late 1990s wool from northern Queensland accounted for 3-4% of the national clip, then it dropped to 2-2.5% in the decade from 2004 to 2013, before reaching a minimum in 2016 a shade under 1%. Since 2016 it has rebounded to 1.5% of the national clip.
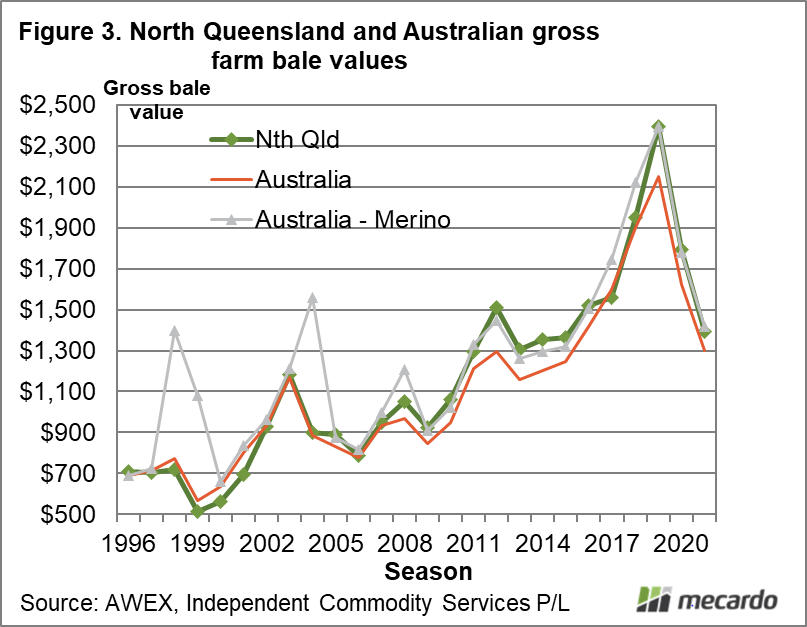
Since the early 1990s the proportion of crossbred wool in the Australian clip increased, levelling out around 20% in the past decade. In northern Queensland merino wool accounts for 97-99% of auction sales volume in clean terms, so it is effectively a merino clip. In Figure 3, the gross dollar value per farm bales sold by season is given for northern Queensland, Australia as a whole (keeping in mind 20% of the clip is crossbred) and for the national merino clip. In recent decades the average per bale value for northern Queensland wool has exceeded the national average by 7%. When the northern Queensland average bale value is compared to the national merino bale average it comes in close to par value.
The final schematic in this article (Figure 4) repeats the format of Figure 3 but with clean prices per kg. Again, the northern Queensland average clean price outperforms the average Australian price (by 4% during the past couple of decades) but when compared to the national merino average price it underperforms by an average of 3.5%.
What does it mean?
Sheep numbers and wool production in northern Queensland have followed the trends of other regions, albeit with a deeper fall in sheep numbers from 1990 onwards (90%). In terms of the value of wool produced, the average clean price for northern Queensland has sold for 96.5% of the national merino average clean price since 2002. The next article will look at wool quality and its effect on price for northern Queensland wool.
Have any questions or comments?
Key Points
- The proportion of clean wool coming from northern Queensland, after falling to around 1% of the national clip in 2016, has lifted to be around 1.5% of the clip.
- The northern Queensland clip is effectively a merino clip so it needs to be compared to the national merino clip not the national wool clip (which has a 20% component of crossbred wool).
- On a clean price per kg basis the northern Queensland clip sells for about 96.5% of the national merino average price.
Click on figure to expand
Click on figure to expand
Click on figure to expand
Data sources: ABS, AWEX, ICS, Mecardo


