For two years the flock rebuild has been quoted as one of the driving factors behind strong sheep and lamb prices. With the release of the Australian Bureau of Statistics (ABS) Agricultural Commodities report at the end of July we have confirmation, with New South Wales being a huge driver.
The headline national sheep flock number came in at 68.047 million head, a 7% increase on the lows of 2020. There was an extra 4.5 million head of sheep in flocks on the 30th of June 2021, compared to 2020.
The flock increase matched the very strong number recorded in 2017 and before that in 2011. For a larger than 7% flock increase we have to go back to 1985 when just over 10 million sheep were added to take the flock to 145 million head. Huge numbers compared to where we are now.
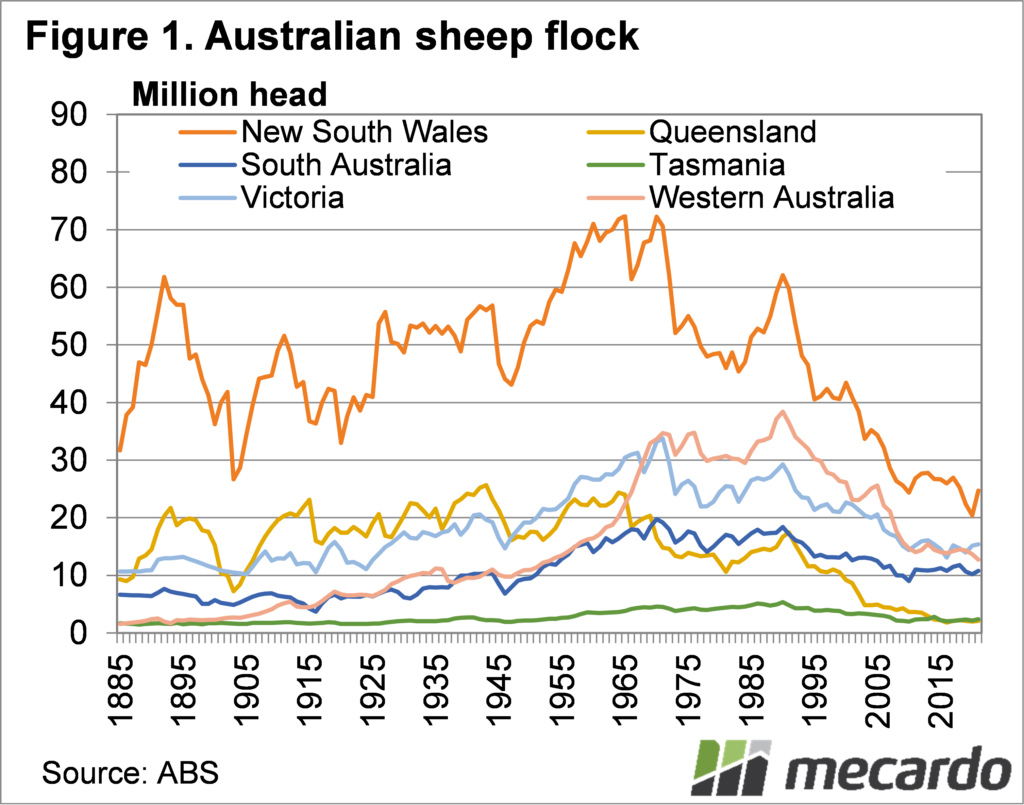
Figure 1 shows how the individual state flocks have performed over the long term. The two big moves we saw in 2020-21 were a very strong increase in NSW, and a a fall in WA.
The NSW sheep flock increased by 21% in the year to June 21, with numbers at a three year high. A 7% fall in the WA flock somewhat offset the increase in NSW. South Australia had a strong increase in the flock, rising 6%, while Victoria was basically steady, with a 1% increase.
The Victorian flock, which is the second largest in the country now, had already recovered in 2020, thus the smaller increase in 2021. The Victorian flock has been largely steady around the 15 million head mark since 2009.
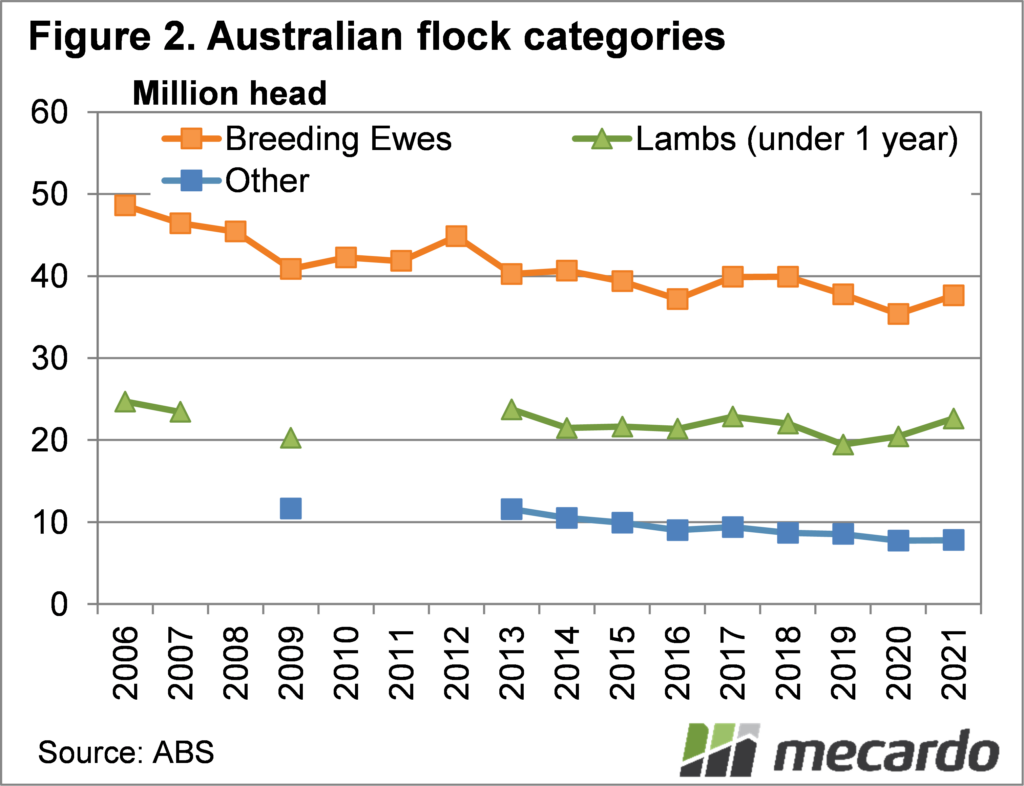
After lamb numbers started tracking higher in 2020, many of these were converted to ewes in 2021, and both contributed to the increase in the flock. Figure 2 shows breeding ewe numbers increased by 6%, to 37.6 million head.
Lambs under 1 year held on farm as at the 30th June 21 were 11% higher, at 22.6 million head. This points towards further increases in the breeding flock when the 2022 data is released.
‘Other’ sheep, not lambs or breeding ewes, are made up of mostly wethers and rams. Other sheep haven’t participated in the flock rebuild at all, with wethers out of favour compared to ewes.
What does it mean?
Despite being a very strong increase, the official flock number for 2021 came in below forecasts. We have, however, seen the impacts of the increasing flock in lamb supplies over the last six months. The ABS data can be broken down into states and regions, and this can give a better idea of seasonal supply trends, and we’ll have more to come on this.
Have any questions or comments?
Key Points
- Official numbers have been released for the June30 2021 sheep flock.
- NSW drove the national herd increase, while WA was the only state to fall.
- Breeding ewes and lambs were both higher in 2021, other sheep steady.
Data sources: ABS. Mecardo


