National Trade, Heavy & Merino Lamb indicators all performed strongly this week, while the Light, Restocker & Mutton indicators fell. Mutton was popular in NSW last week, with a big lift in yardings and slaughter both doubling on the week prior to last.
For the week ending the 16th of July, east coast lamb throughput increased by 5% to see 186,963 lambs yarded. While it wasn’t a huge lift on last week, it was an 85% lift on this time last year. Most of the increase came from NSW, while most states were either steady or fell in supply. NSW saw an extra 12,862, or 10%, supply of lambs to their yards, to see 138,246 sheep yarded for that state. Over in WA there were around 2000 less lambs yarded than the week prior, with 6,361 lambs yarded there.
There was an extra 17, 967 sheep (mutton) yarded on the east coast for the week ending 16th of July. NSW contributed the most again, providing an extra 15,160, a whopping 45% increase on the week prior. Sheep yardings rose slightly in all other eastern states, but fell in WA, with just 2000 sheep yarded.
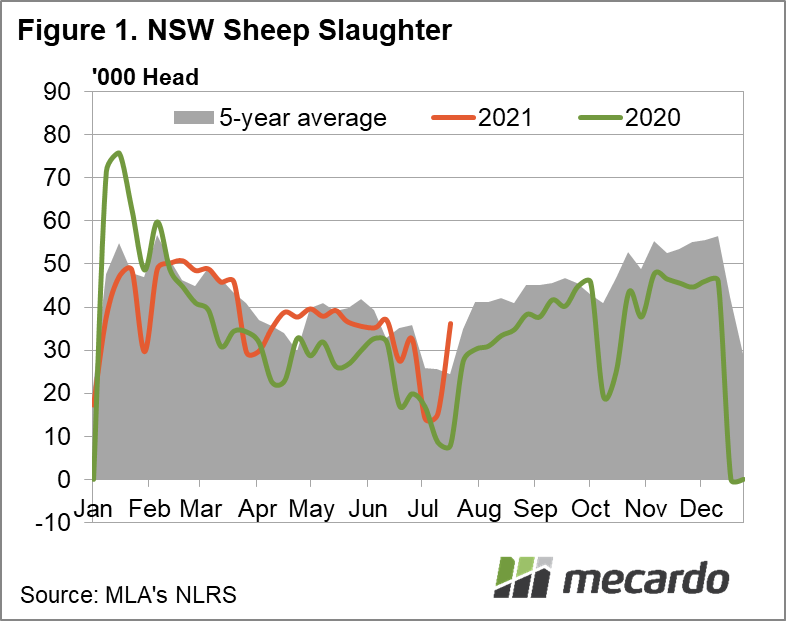
Slaughter volumes were generous for the week ending the 16th of July 2021, especially for sheep, which we’ll take a look at first. The east coast saw a 53% increase in sheep slaughter on the week prior and a huge 265% increase on this time last year, when just 19,845 sheep were processed. 72,435 sheep were slaughtered on the east coast in total last week. NSW kept up with the higher supply and slaughtered more than 50% more sheep than the week prior, with 36,178 sheep slaughtered there, compared to 15,152 the week prior. This is just above the 5-year average NSW slaughter levels also. Vic saw a slight increase from just over 29,000 the week prior to 32,464 sheep slaughtered last week.
Lamb slaughter volumes were up on last week too, and well up on this time last year. We saw a 5% lift on the week prior, with 326,468 lambs yarded on the east coast, compared to 311,362 the week prior, an also a 22% increase for the same time last year. No surprise, with it’s higher yardings, it was again NSW leading the charge with an extra 17,000 or 16% more lambs slaughtered for the week ending 16th July 2021, with a total of 117,091 lambs slaughtered there. Vic saw a slight fall, with 175,110 lambs slaughtered there, while SA lamb slaughter numbers rose to 28,472 .
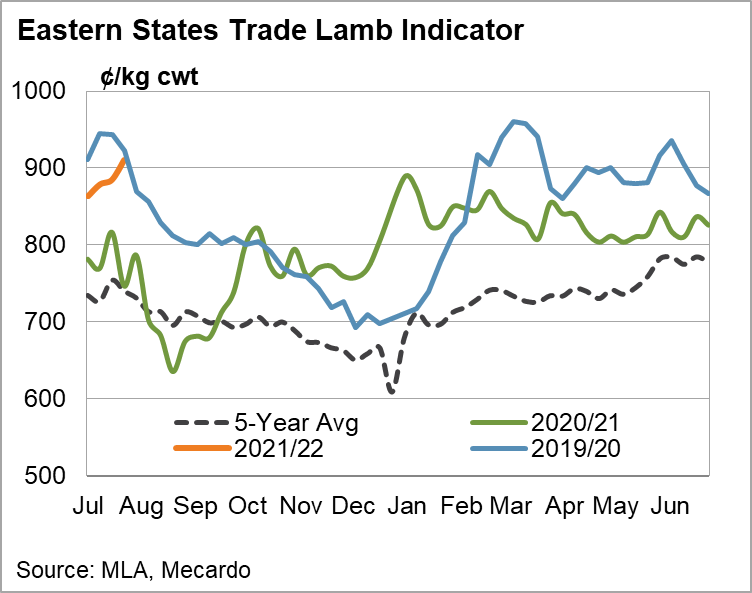
The market certainly handled the jump in yardings and slaughter numbers well, with the Eastern States Trade Lamb Indicator moving 25ȼ higher than last week to finish, as of Thursday 22nd of July, at 910ȼ/kg cwt. A 2.8% change on this time last week and a 22% change on this time last year. The last time the ESTLI was above 900 cents was in June 2020, and it is now a significant 170 cents above the 5-year average. In the West, the Western Australian Trade Lamb Indicator (WATLI) lost 52ȼ to 712ȼ/kg cwt.
To the National Indicators and Heavy, Merino & Trade lambs all performed well. The National Heavy Lamb indicator settled at 911ȼ/kg, a 38ȼ rise on the week prior and 226ȼ higher than this time last year. Heavy lambs in NSW and Vic lifted 43 & 20 cents respectively on the week prior to sit at 918 & 910ȼ/kg, 227 & 247 cents higher in both states than this time last year.
Light lambs were down slightly in NSW though, falling 10 cents, but up in VIC, finishing last week 20 cents up to settle at 874ȼ/kg while they were 840ȼ/kg in NSW.
The National Restocker Lamb and Mutton indicators eased as well, falling 39 and 13 cents respectively, with the National Restocker Lamb Indictor sitting at 833 and Mutton at 674, still both up 73 and 88 cents on this time last year.

The week ahead….
The market seems to have absorbed the increase in supply and yardings well, especially considering the impacts of COVID lock downs affecting the two biggest sheep and lamb producing/processing states in the country. It will be interesting to see if numbers VIC will follow NSW’s suit and lift it’s yardings and slaughter too.
Have any questions or comments?
Click on graph to expand
Click on graph to expand
Click on graph to expand
Data sources: MLA, NLRS, Mecardo
