In March Mecardo looked at a merino price series over the past century, investigating when the largest down cycles (peak to trough) occurred. At the time the greasy wool market was down a regular 30% on 2018 peaks. This article continues on from it, adding the COVID-19 effect to the analysis.
In March Mecardo looked at a merino price series over the past century, investigating when the largest down cycles (peak to trough) occurred. At the time the greasy wool market was down a regular 30% on 2018 peaks. This article is a continuation of the previous, adding the COVID-19 effect to the analysis.
Peak to trough analysis has the advantage of being simple and not requiring any great manipulation of the base data. In this case the change in the deflated merino prices compared to the highest level of the preceding five years is used as a measure of down cycles, and the price compared to the lowest price of the preceding five years is used as a measure of rising cycles.
In Figure 1 the price series has been pushed back to 1911 (it’s marvellous what can be found looking through old computer files) and has been deflated to reflect more comparable to current values. 1951 stands out as the peak price point along with high price levels during the First World War. The 2018 peak price took the deflated price back up to late 1988 levels, and now the 2020 downturn has taken the merino price back down to levels last seen briefly in 2009 and before that in 2000.
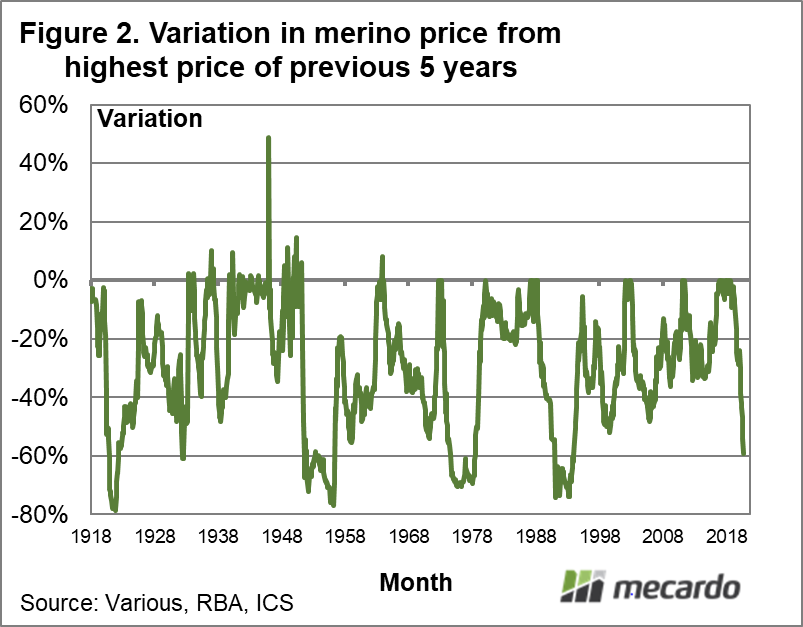
Figure 2 shows the peak to trough falls in price from 1916 through to this month, always looking back at the highest deflated price level of the previous five years. With the effect of COVID-19 added, the current cycle is down a hefty 60% of the 2018 peak level. The four big down cycles of the 20th century bottomed in 1921 (down 75%), 1955 (down 75%), 1975 (down 69%) and 1991-1993 (down 73%). The current downturn is on par with 1932 (the Great Depression of the 1930s). From a simple historical perspective, the big down cycles indicate the wool market could fall further (maybe another 10-15%), but it is likely getting close to a base.
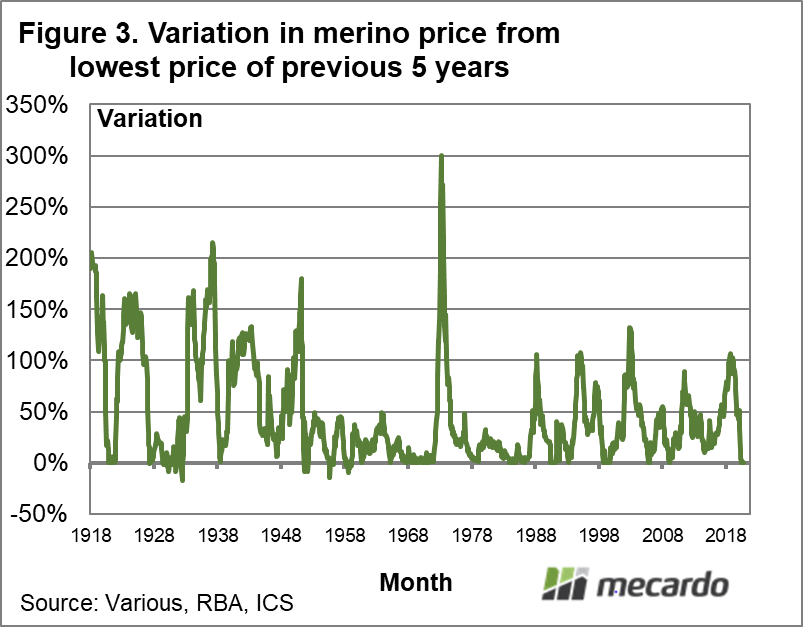
Figure 3 shows the reverse analysis, trough to peak rises. The price is compared to the lowest level of the preceding five years. In the first half of the 20th century rising price cycles typically rose by 150% to 200%. Volatility fell away in the 1950s and during the period of the Reserve Price Scheme before its self-destruction. Since the late 1980s the standard rising cycle in deflated prices has been 100%. History says, that in looking on the other side of the pandemic, we can build in an expectation of a rising price cycle where prices potentially double. The timing, however, at this stage is most uncertain.

What does it mean?
The current down cycle in merino prices (down 60%) is a large one but not yet as large as the four main down cycles of the 20th century, which fell an extra 10-15%. Unfortunately, this means historically there is some precedent for further downside in the coming months if demand does not improve. On a brighter note most of the downside has already occurred for the cycle. Now, the uncertainty centres on time, and how long before we can expect prices to start picking up.
Have any questions or comments?
Key Points
- The added effect of COVID-19 has deepened the current downturn – it is now on par with 1932.
- The four biggest downturns of the 20th century fell in price by 70-80%.
- Prices are currently down 60% on 2018 highs, so there is potential for prices to fall in the next couple of quarters.
- The downturn in price in 1921 (following the Spanish Flu) saw prices fall by 75%, before recovering well in 1923.

Click on figure to expand
Click on figure to expand
Click on figure to expand
Data sources: RBA, ICS, Mecardo