Australia is on track to produce the second-highest barley crop on record, and there is no end in sight for the Chinese barley tariff and suspensions afflicting the market. Domestic barley consumption was strong last year, but even at record levels, there will be plenty of barley to be moved into export markets or carried over into next season.
Last week marked the start of harvest, at least the first report from Graincorp. As of the 27th of October 428,000 tonnes had been delivered in Queensland, and 260,000 tonnes in Northern NSW. So some barley is rolling in, but not enough to put harvest pressure on the market yet.
Regardless, we thought it would be worth looking at the barley market, and how much has historically been exported, and how much stays at home for use in local manufacturing and animal feed.
The Australian Bureau of Agricultural and Resource Economics and Sciences (ABARES) publishes production and export figures, and from this we can deduce how much of each crop has been consumed domestically, or carried over into the next season.
Figure 1 shows national barley production, which, apart from the spike in 2016 has been remarkably consistent over the last 12 years. WA usually produces between 30% and 50% of the national crop which adds some geographical diversity to production and helps to keep it consistent. This year ABARES are forecasting a 2.2mmt, or 24.5% lift in barley production, which will have to go somewhere.
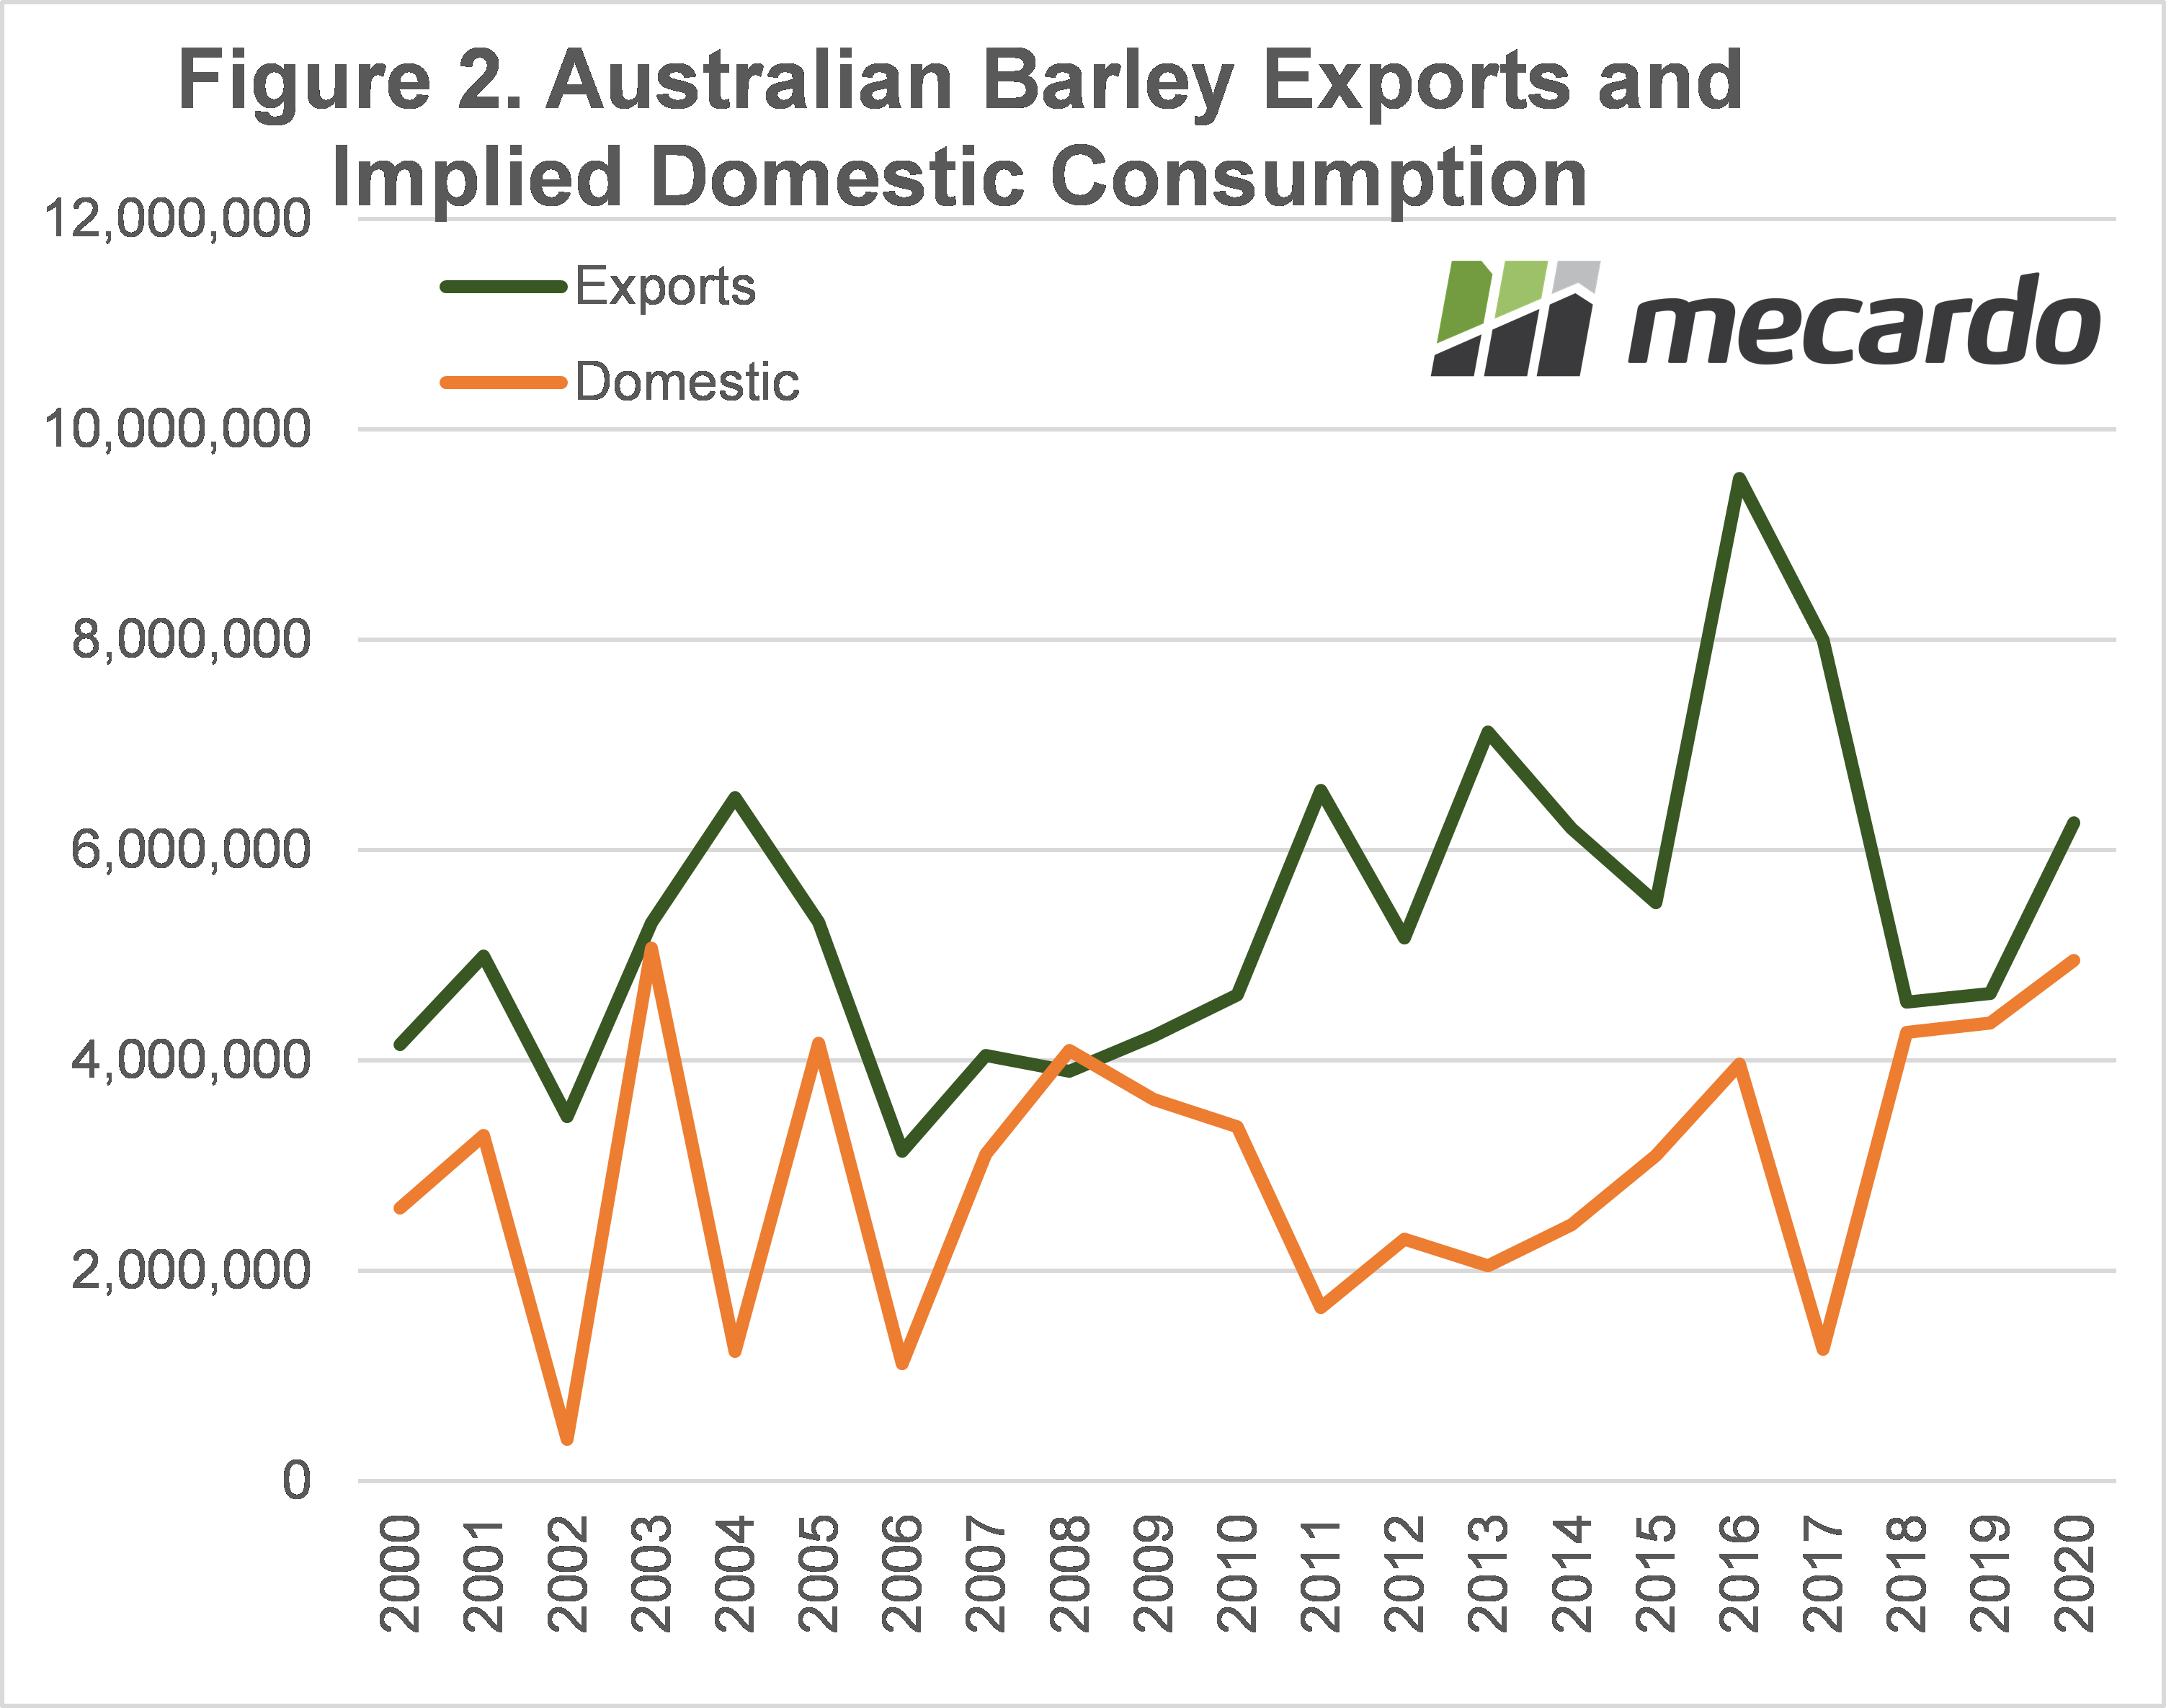
Figure 2 shows Australian barley exports and the implied domestic consumption. Not all the implied domestic consumption will be used, especially after two years of lower total grain production, some will be used to rebuild stocks.
The export forecast for this year is interesting. ABARES have pegged barley exports for 2020-21 at 6.3mmt, up 35% on last year. A strong rise in export would be expected with increasing production, but when the main market of the last five years is closed it will make it difficult.
Still, we can also see in figure 2 that the capacity for the domestic market to use barley is limited. The amount of barley staying in Australia will increase to the highest level since 2003. Back in 2003 stocks were very low, and they were built with barley staying onshore.
We will see some of the same this year, but it will lead to very strong stocks, as demand for feed will be down with fewer cattle in feedlots, and much more grass and hay available.

What does it mean?
Domestically, barley is going to have to start pricing itself into feed markets where wheat is traditionally used to get consumption up, and we have seen this in the last couple of weeks. Figure 3 shows F1 Barley has made some attempt to follow wheat higher but is falling behind. In Geelong, last week barley was at a $74 discount to ASW.
This is enough of a discount to see barley working its way into dairy and feedlot rations, but the spread suggests that for harvest sales, growers would be advised to get rid of milling grades, as there might be some more upside in barley post-harvest.
Have any questions or comments?
Key Points
- With the second-highest barley crop on record forecast, plenty will have to be used domestically.
- Total feed demand will be lower, so barley will have to price out ASW.
- Feed Barley has moved to an over $70 discount to ASW, which should see consumption increase.

Click on figure to expand
Click on figure to expand

Click on figure to expand
Data sources: ABARES, Reuters, Mecardo