Do national Processor Steer indicator index prices really provide a good guide as to changes in the value of trade cattle week to week? Or are there reasons we shouldn’t read too much into short term changes in this price? The devil is in the detail that sits behind the published prices each week.
The National processor yearling steer indicator price index is theoretically supposed to be comprised of the prices fetched by 330-400k lwt C3 cattle from 38 saleyards across the country. This wide net of reach should, in an ideal world capture substantial volumes of cattle being transacted each week, resulting in very representative and stable prices.
In reality however, this is not the case – in the past week, the volume transacted within the index averaged only around 60 head, across around nine of the saleyards.
The sales making up the index are currently concentrated in South Australia, with SA livestock exchange, Naracoorte, and Mount Gambier often collectively representing 50-60% of the index. (figure 1)
The east coast slaughtered over 90,000 head last week, yet only 50 steers went through the saleyards – what is going on here?
We know that on average, over 90% of Australian cattle destined for slaughter never pass though a saleyard on their final journey off the paddock and into a meatworks. Most are transacted direct to processor, or over the hooks (OTH). In Queensland, this proportion is even higher due to the prevalence of feedlots in the supply chain which generally do not turn off via saleyards.
Add to that the very tight specification of the index, meaning that transactions of cattle outside this weight range, fat or muscle score are not included in the calculations.
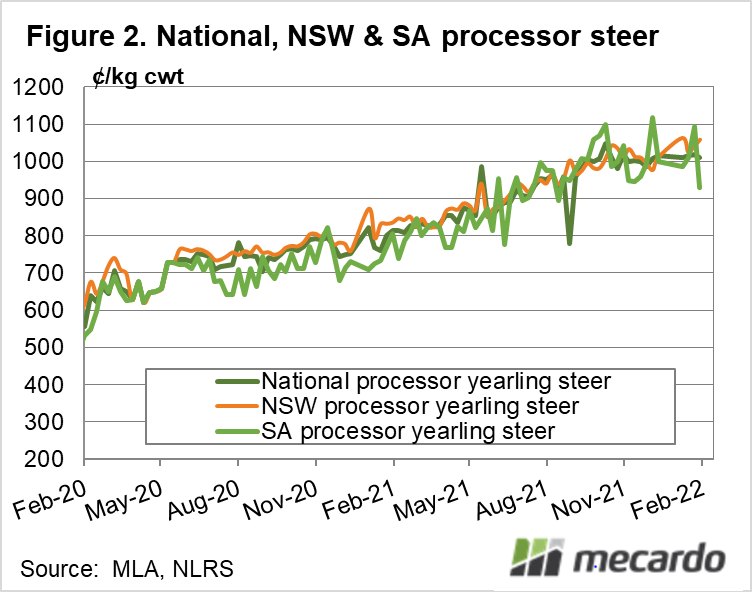
These two factors intertwine to focus in on a very low volume of cattle, meaning that the reported price indexes can experience some volatility as the makeup of the index can swing day to day in response to fluctuating yarding’s figures, due to differing proportions assigned to different geographical locations. Cattle prices can vary substantially on location due to localised supply and demand impacts. Figure 1 illustrates that the spread between NSW and SA price can be as large as 100c/kg, while the light blue and green background shading indicates that shifts in the geographic bias of the national indicator occur regularly.
This illiquidity driven noise in the price index means that when we see a shift in prices, it may not be because the underlying value of processor cattle has actually moved, but more so that the geographic location the pricing effectively represents may have changed because of as few as 20 extra head in a particular saleyard. This is probably nothing to get excited about, little has changed in underlying values apart from the viewpoint the price index has taken.
The good news though, is while the pricing of the index might not be as comparable week to week, general trends can still be identified.
What is clear from looking at the index volumes currently though, is that processors aren’t sourcing large lines of this specification of cattle from the saleyards – they are opportunistically picking up oddments, and given the comparatively low price, these are animals that restocker buyers probably didn’t like the look of. Combined with the low volume of cattle, this suggests that the index could also be exaggerating any quality-based price fluctuations reflected at particular saleyards, which may not be fully applicable to the specification in general.
As a result, if you are considering selling young trade cattle, it is definitely worth examining over the hooks and restocker pricing, depending on what you are looking to market.

What does it mean?
The National Processor Steer price indicator index is generally characterised by low transaction liquidity, and the artificial price volatility that goes with it. This means that in the short term, price movements can reflect not only shifts in the value of cattle, but also the saleyards which contribute the majority of cattle sold for that indicator category that week.
Consider this indicator’s pricing with a grain of salt and consult OTH grids, and other pricing information when making marketing decisions.
Have any questions or comments?
Key Points
- National indicators might be based on low numbers of head.
- Illiquidity can cause artificial short term price volatility.
- Consider other data sources in tandem to estimate values and trends.

Click on figure to expand
Click on figure to expand
Data sources: ABS, MLA
