As the size of the Australian herd fluctuates with the whims of the seasons, not all areas of Australia are equal in their influence upon herd liquidations and rebuild cycles. For example, Queensland, the NT and the Kimberly typically account for around half the national herd. Rain is the lifeblood of the land, and today we look at how the intensity of the northern monsoon impacts shifts in the cattle herd.
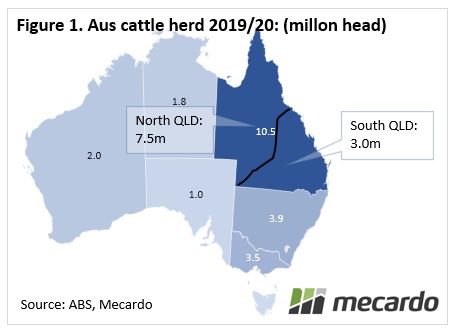
QLD cattle historically account for around 45% of Australia’s’ national herd. For the purposes of today’s analysis, we split QLD into two sections- The south (13% of total herd) starting in the Fitzroy basin, sweeping down to the border, and the north (32%), comprising from the desert channels in the south west, through the Burdekin region and up to Cape York, which is outlined in black (Figure 1).
The bulk of the Queensland monsoon season extends from November to the end of March in the following year. It’s always pretty damp up there over this period compared to other parts of the country, but the question is, how do we classify a good monsoon in the north?
When looking at weather data, representing it as deciles in terms of where it sits in the spectrum of past years, statistically speaking, can be a good way of comparing monsoon intensity year to year.
To put this season(2021/22) in comparison to last, its quite clear that most of northern QLD’s cumulative rainfall this year has been well above average, at decile 8-9 in most of the north. A large amount of land in Southern QLD experienced decile 10 rainfall also. Last year, however, came in average to below average, with big swathes of north eastern QLD suffering rainfall in the bottom 30-40% of years. (figure 3)
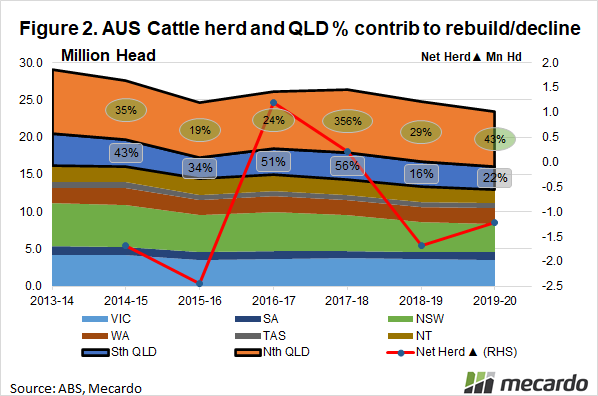
In response, the Northern QLD herd contracted 7% on the prior year, with southern QLD shedding over 8% of its cattle population, contributing 43% and 22% respectively to the net decline in the national herd. (figure 2)
The drought of 2018-2019 was an even poorer monsoon season, with an even greater area only receiving decile 3-4 rainfall, with a 6% decline in the QLD herd being booked.
The delayed impact of good seasons.
Our last rebuild was in 2016-18- let’s examine what QLD weather was doing at this time.
The 2015-16 monsoon season was an average year in the scheme of things, which set up the land for a solid year in 2016-17, resulting in a net herd rebuild of 1.2m head. Southern QLD expanded 22% from the prior year, and northern QLD 4%, respectively representing 51% and 24% (figure 2) of the net national rebuild.
The following year, the 2016-17 monsoon season was average to below average, with the far north east of QLD faring better than its southern counterparts. The result was that in 2017-18, the far northern herd expanded 10%, and southern QLD 4%. The rebuild had lost momentum by this time, only adding a net 200K head with cattle numbers across the rest of the country declining 700K head, offsetting the significant growth in QLD of over 900K head. Overall, the QLD region represented a collective 400% of the net rebuild for the year (figure 2)
Given that the 2021/22 QLD monsoon season was historically exceptional, this is indicative that the conditions are supportive of a strong herd rebuild in the following year, 2022/23, in line with MLA’s recent forecasts.

What does it mean?
Good seasons in QLD, particularly the far north, are key to the overall national rebuild of the cattle herd on a one year lagged basis. This year’s monsoon has shaped up to be an absolute cracker, with widespread rainfall in the top 20% of years historically, so we can expect strong growth in the QLD herd in the coming year.
Have any questions or comments?
Key Points
- QLD, particularly Northern QLD has the largest impact on the national herd
- Good monsoon seasons influence the following year’s herd growth
- The 2021/22 monsoon season has been brilliant, and is likely to flow through to a strong rebuild in 2022/23.
Click on figure to expand
Click on figure to expand
Click on figure to expand
Data sources: ABS, MLA, BOM, Mecardo
