If beauty is in the eye of the beholder then wool quality is most certainly in the eye of the buyer. This article takes a look at some measures of quality from the perspective of the buy side in the market.
The machinery used by the supply chain to convert wool to yarn and fabric has developed in tandem with supply over the centuries. So, in effect, machinery is optimised to the average wool qualities/specifications which are expected year in year out. The challenge for an industrial process which uses an agricultural commodity is to handle the natural variations inherent in a commodity such as wool. The best processors can and do adjust their machinery for changes in wool quality but season in season out the supply chain tends to focus on the longer run average specifications of wool production. This can lead to a mismatch between supply and demand.
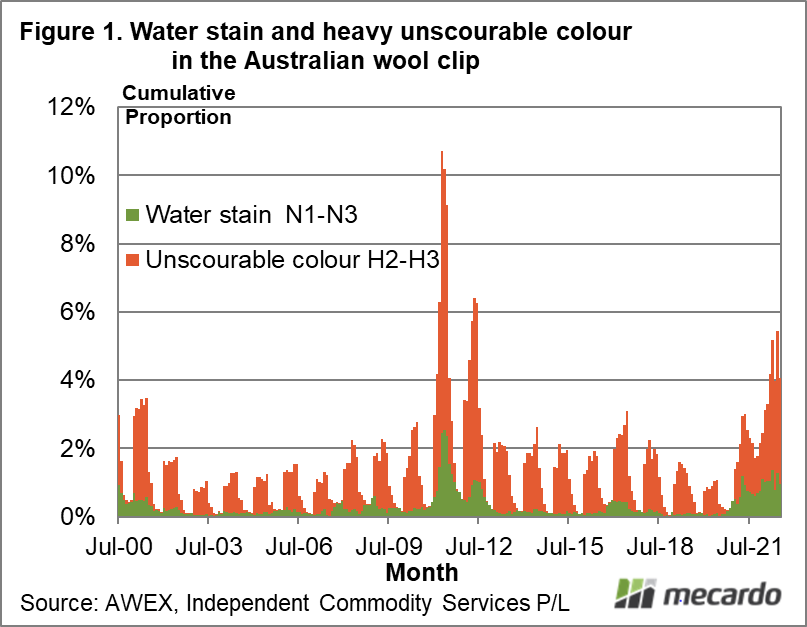
Figure 1 shows the cumulative proportion of water stain (N1-3 in the AWEX ID) and heavy unscourable colour (H2-H3 in the AWEX ID) by month for the Australian clip from the year 2000 through to mid-2022. There is a clear seasonal pattern with the proportion generally low in the first half of the season and higher in the second half of the season. In most seasons the combined proportion of water stain and heavy unscourable colour peaks in the range of 1% to 2%, except after wet seasons. 2011 and 2012 stand out as a time when the proportion rose to 10% and 6% respectively. In June the proportion rise to 5.5%, this is two to three times the normal level.
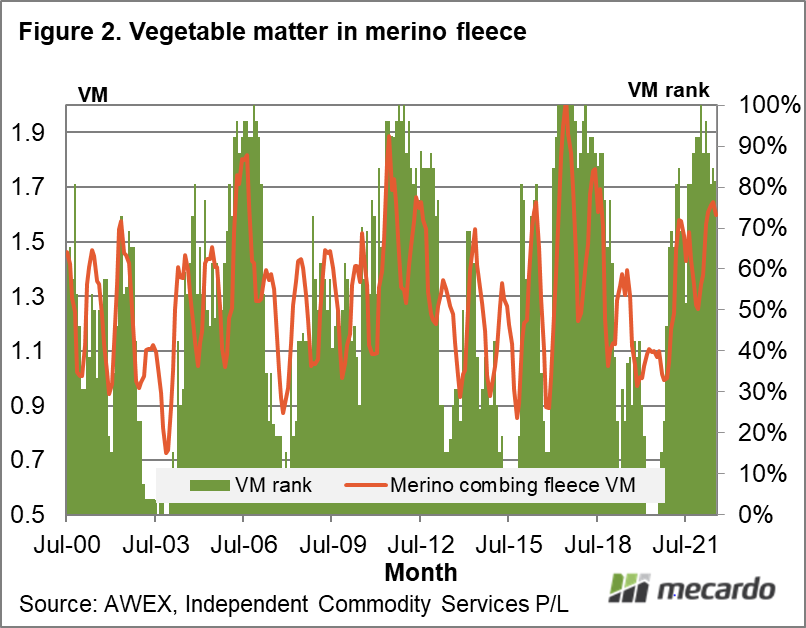
Mecardo has looked at vegetable matter (VM) levels in previous articles late May and mid-April. Figure 2 shows the monthly average VM level for combing length fleece in the Australian clip sold at auction from mid-2000 onwards. In addition the percentile rank of the VM level (using all data from the 1990s onwards) is shown, to highlight where VM levels are high and low. The ranking varies with the bigger seasonal swings in conditions with a low ranking generally following drought and high ranking following recovery from drought. There is a strong seasonal pattern to the actual VM level (low towards Christmas and high towards mid-year) but it is in years like 2021 and 2022 when the level rises so that it becomes difficult for processors to build their consignments with standard VM levels that the drought/non-drought large cycle overwhelms the normal seasonal pattern. VM has certainly been restrictive for consignment building during the past year.
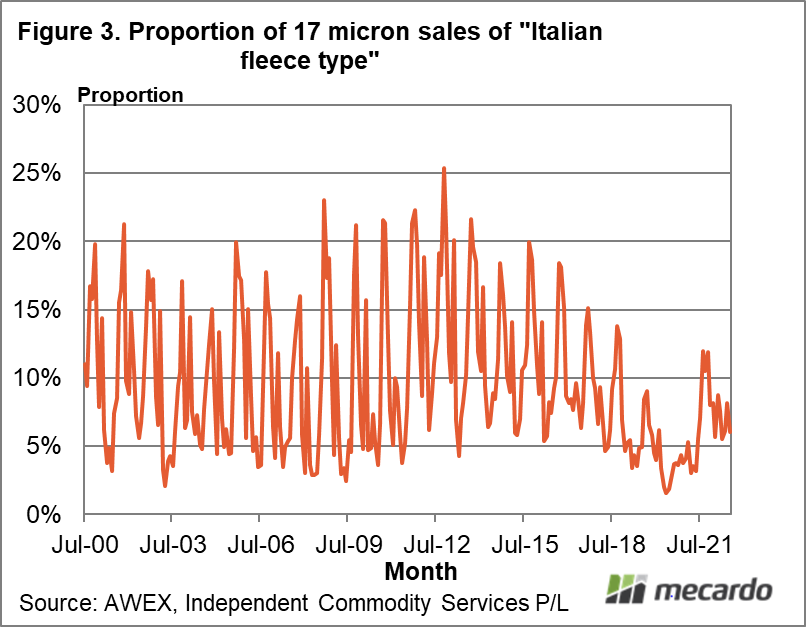
Market comment in recent weeks has indicated firm prices for the better fine merino fleece types. This is where the eye of the beholder becomes important. Supply of these better types varies because of wool’s production in an agricultural system. As a guide 17 micron fleece with a style of 4 or better, VM 2% and lower, a staple length of 66 to 95 mm, staple strength of 39 N/ktx and greater, P certificates, no subjective fault (such as shown in Figure 1) has been filtered out and the proportion of total 17 micron wool sold at auction shown in Figure 3. This is not necessarily an actual “Italian style” fleece but is a proxy for the supply of these better style types. Note that mulesing status and quality scheme accreditation has not been included, factors which will whittle the supply down much further.
There is a distinct seasonal pattern to the proportion of good 17 micron fleece, peaking in September/October and reaching a low late in the season. While the current proportion is 6%, which is close to the July median for the past decade, the proportion since 2019 has been markedly lower than in the previous 18 years. From the perspective of users of best quality 17 micron wool, the past three years have been lean times.

What does it mean?
The supply of fault in the Australian greasy wool clip helps to drive the discounts applicable for these faults, especially when the supply deviates markedly from normal levels. The flip side to this is that the supply of best quality wool types, which is impacted the ebb and flow of the presence of faulty wool, impacts on the relative price (premiums) for the best fleece wool. Demand is important is driving prices and premiums but supply plays a substantial role as well.
Have any questions or comments?

Key Points
- Wool quality from the perspective of water stain, heavy unscourable colour and vegetable matter is low in the Australian clip.
- These are cyclical characteristics in the Australian clip, linked to the swings between droughts and recovery from drought in Australian sheep regions.
- The proportion of best fleece wool in the Australian 17-18 micron categories has been markedly low during the past three years.
Click on figure to expand
Click on figure to expand
Click on figure to expand
Data sources: AWEX, ICS