
Seasonal conditions drive changes in the quality of wool, which is a challenge for the supply chain – linking up agricultural supply with all its variability to industrial processors who by definition prize consistency. With this in mind this article takes a quick look at where the merino fibre diameter is in relation to rainfall.
Fibre diameter has been the main determinant of merino wool prices, albeit to a varying degree, since the advent of the modern market with objective measurement. Seasonal conditions are the key driver of year to year changes in fibre diameter, with rainfall in turn the key driver of seasonal conditions. Changes in fibre diameter are also linked to changes in clean fleece weights (positively correlated).
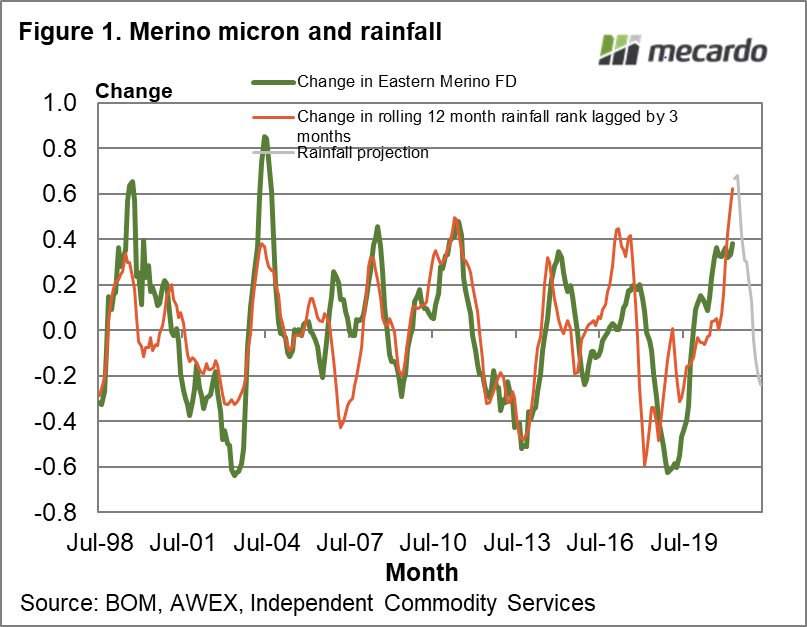
Figure 1 summarises the relationship between changes in the eastern Australian average merino fibre diameter and change in rainfall. The rainfall has been turned into rolling 12-month rainfall ranks and averaged across the different regions (weighted for production out of the regions) with the change in the ranking shown in Figure 1. In addition, the change in rainfall rank has been smoothed by three months and then lagged by three months. The lag gives the rainfall series some forecasting ability of three months. The use of a rolling 12 month rainfall rank means that historical rainfall data can be substituted into the series to give a median projection, out a further 12 months. This projection is also shown in Figure 1.
The merino fibre diameter began to rise above year earlier levels in very late 2019, which seemed early at the time as the drought in NSW and Queensland was still in full flight in many regions. Rainfall in early 2020 took some months to show up in the rolling 12 month rainfall rank, but when it did it pulled the rank up 6 deciles above year earlier levels, which was the biggest recovery shown in Figure 1 which runs from the late 1990s onwards. The change in the merino fibre diameter has tracked higher but only on par with previous recoveries since 2008.
At this stage the rainfall rank data points to a peak increase in mid-2021, with the increase abating from there through to the end of 2021. This pattern points to the merino fibre diameter being broader than year earlier levels through to late 2021. The implication is that sub-18-micron volumes will continue to be below year earlier levels through the coming spring, and clean fleece weights will, on average, continue to increase. The continued reduction in sub-18 micron wool is likely to help support the steep micron price curve which has developed in the past year.

What does it mean?
From a production perspective the supply factors which have helped drive the increase in merino micron premiums and discounts (the micron price curve) will melt away in 2022. Demand plays a role in determining this aspect of the greasy wool market also, and with the premiums and discounts near old cyclical maximums it is likely a reaction on the demand side will be seen in 2022. In an ideal world, it seems time to hedge/sell fine micron premiums.
Have any questions or comments?
Key Points
- The year-on-year increase in rainfall rank is likely to peak in mid-2021, which implies the increase in merino fibre diameter will peak at the same time.
- There is a good chance that the merino fibre diameter will remain broader than year earlier levels through to late 2021, helping to support the steep micron price curve through the spring.
- In 2022 the change in micron should settle which will allow the micron price curve to flatten from its current steep incline.
Click on graph to expand
Data sources: BOM, AWEX, ICS, Mecardo


