Discounts for vegetable matter (VM) reached some extreme levels early this season, and remain at substantial levels for medium and fine merino wool. This article takes a look at the regional sources of VM during the past year.
Vegetable matter in the Australian wool clip comes mainly from regions with rainfall which is distributed throughout the year (uniform), summer orientated or summer dominant. In effect, this means northern South Australia, much of NSW and of course Queensland. An interesting point as that these rainfall zones are moving southwards so the zones of higher VM production are expanding, while the zones of low VM production are contracting.
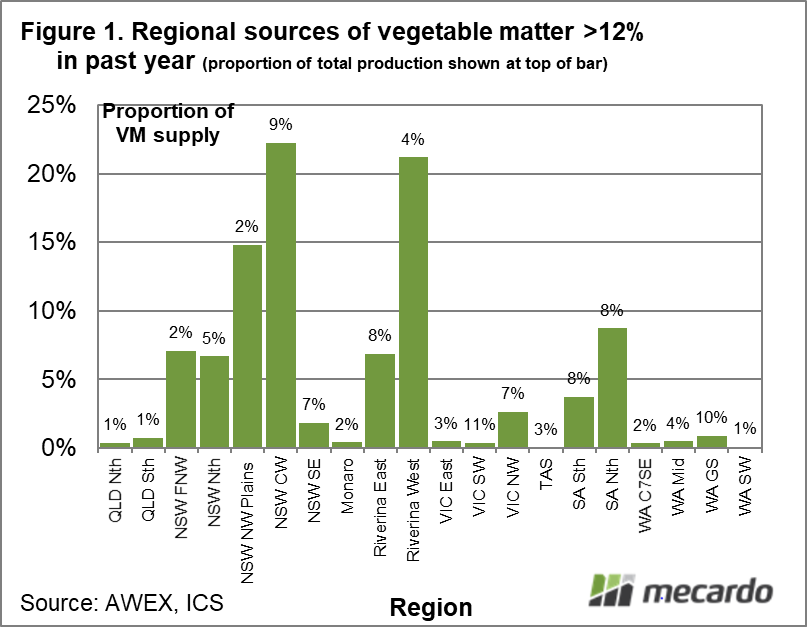
Starting at the high end of vegetable matter production, Figure 1 shows the regional sources of wool with VM levels greater than 12% (wool which requires carbonising or removal by chemical means rather than physical means). The bars show the proportion of this category of wool which comes from each region. To put this in context the overall supply of greasy wool from each region is shown in percentage terms (for the past year) at the top of each column. For example, the NSW central West region supplied 9% of overall greasy wool in the past year, and was the top source of 12% plus VM wool, supplying 22% (one fifth) of this high VM category. The Western Riverina was not far behind, supplying 21% of the 12% plus wool, from a much lower base of 4% of the national clip.
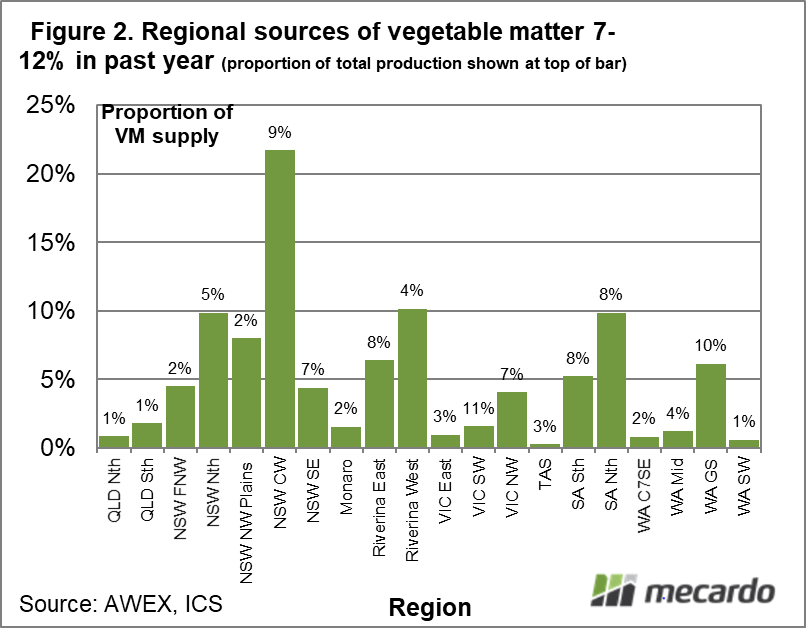
Figure 2 repeats the analysis for 7-12% VM wool. Central West NSW is the star supplier again, accounting for 21% of this VM category. Northern NSW, the Western Riverina and northern South Australia were next in line, each contributing 10% of the 7-12% VM wool sold in the past year.
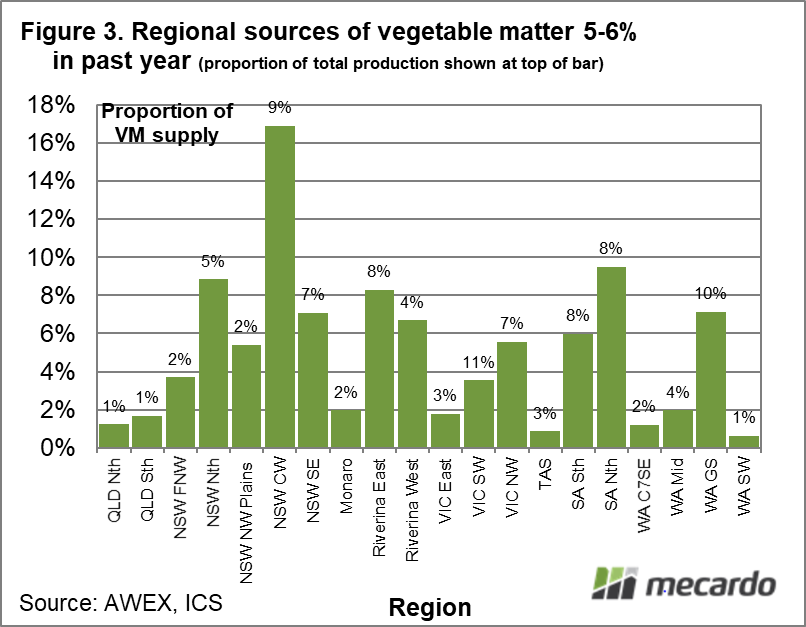
In Figure 3 the analysis looks at 5-6% VM wool, with the NSW Central West again leading the way. The Great Southern in Western Australia was the standout supplier of higher VM in Fremantle.
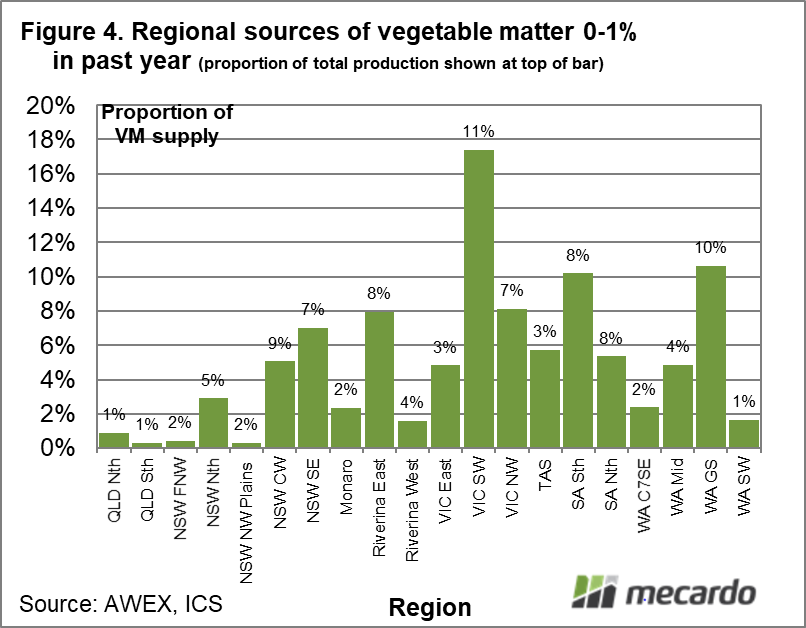
The analysis switches to FNF wool (0-1% VM) in Figure 4. The winter and winter dominant rainfall zones come into their own for the supply of FNF wool with southwest Victoria, southern South Australia, Tasmania and Western Australia holding their own or exceeding their overall proportion of total supply.

What does it mean?
The variation in VM production by region is complicated by the variation in sheep carried in the different regions. Since the 1990s sheep production in south west Victoria and southern South Australia has swung back from historically high levels of merino towards prime lamb production. By default this has concentrated merino production in the higher VM production regions, a trend intensified by a southern movement in the rainfall zones. The average VM in the merino clip is likely to be higher than would have been expected two decades ago.
Have any questions or comments?

Key Points
- VM production in the Australian wool clip comes mainly from NSW, northern South Australia and Queensland.
- Droughts and floods, more often than not, have an uneven impact on the different wool production regions. This means the swings in seasonal conditions will have an uneven impact on VM levels in the woolclip.
- A move south by the rainfall zones will tend to increase the supply of VM in the Australia woolclip.
Click on figure to expand
Click on figure to expand
Click on figure to expand
Data sources: AWEX, AEGIC, Agrometeorology Australia, ICS