
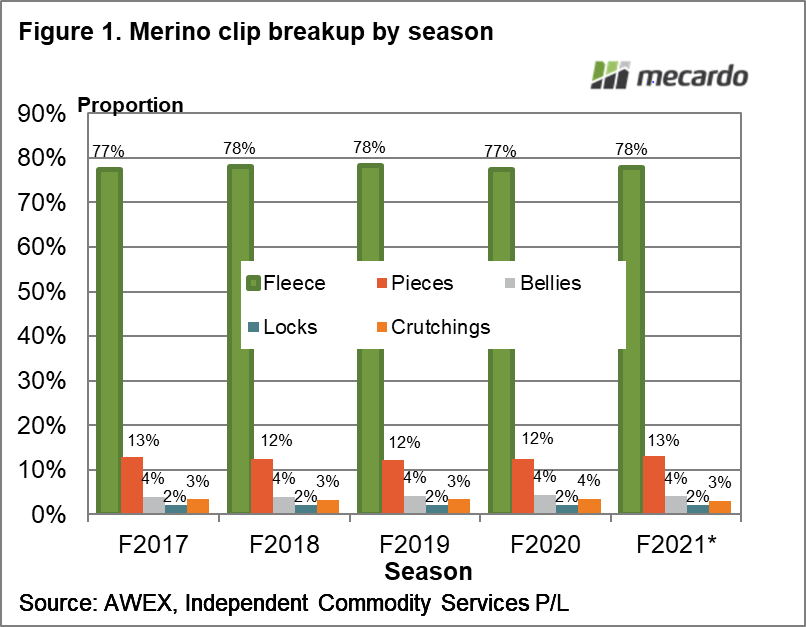
Earlier this week Mecardo looked at the typical breakup of clips of different breeds in Australia. Like all averages, the typical breakup of merino clips covers a range. This article looks at the breakup of merino clips across different geographical regions.
Short of analysing individual clips, in order to ensure all the appropriate wool is included, Mecardo has selected wool from a number of geographic regions. This is not a foolproof method as wool can be lost to broker rehandling services, or for mainland regions wool is gained or lost from other regions (wool is allocated to a wool statistical area when it arrives in store – a less than perfect process).
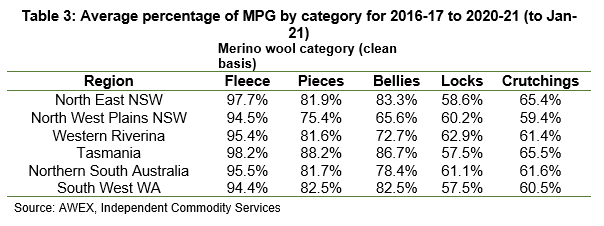
Table 1 shows the average breakup (across four and one half seasons) of clips from six regions (north east NSW – effectively the northern tablelands, north west plains of NSW, the western half of the Riverina (broader with plenty of vegetable matter), Tasmania, northern South Australia and South West Western Australia. It is noticeable that the merino clips from north east NSW and Tasmania sell less fleece (around 70%) with more locks, crutchings and bellies.
There is marginally less fleece and more pieces in north east NSW compared to Tasmania which may simply be a result of higher vegetable fault (2.6% in the northern tablelands of NSW versus 0.9% out of Tasmania). Of the regions listed in this article the North West Plains have had the highest vegetable fault, averaging 5.8% for the past four seasons, followed by the Western Riverina with 3.7%.
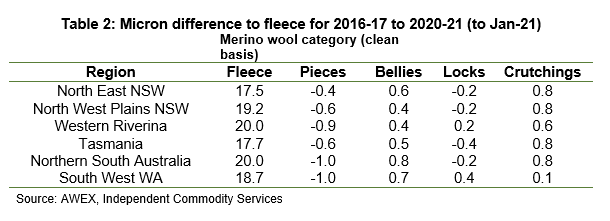
Table 2 shows the average fleece fibre diameter and the average variation of the fibre diameter for the other categories from the fleece, for each region. Both Tasmania and north east NSW are substantially finer than the other regions, around 17.5 micron for the fleece. Finer wool clips tend to sell a lower proportion of wool as fleece. The other regions, which have a fleece fibre diameter ranging from 18.7 to 20 micron, tend to sell 80% of their clips as fleece (on a clean wool basis).
From a budgeting perspective the 10% less wool for fine clips sold as fleece leads to lower returns as more wool is sold in the lower value categories.

What does it mean?
Historical clip preparation data provides a good base for budgeting, in terms of the proportion of wool going into the different categories which have different values. The biggest variation is for fine merino clips which tend to sell some 10% less wool as fleece than the average clip performance in Australia, selling that missing 10% of wool as lower value categories.
Have any questions or comments?

Key Points
- Fine Merino clips tends to sell less wool as fleece – how much of this is due to the sheep and how much due to culture is up for debate.
- High levels of vegetable fault seem to reduce the proportion of wool sold as fleece by 2-4%.
- Northern South Australia come in with a high 84% of wool sold as fleece.

Click on figure to expand
Click on figure to expand
Click on figure to expand
Data sources: AWEX, Independent Commodity Services P/L , Mecardo.


