Seasonal price patterns are useful guideposts when making short-term selling decisions for commodities, although they do change with time. In response to a reader’s question this article takes a look at the interaction between seasonal patterns for both price and sales in the 21-micron category.
Mecardo looked at the changing seasonal patterns for the 21-micron category in January, in response to a request from a South American reader (view article here). In response to this article the same reader has asked about the correlation between price and supply on a seasonal basis.
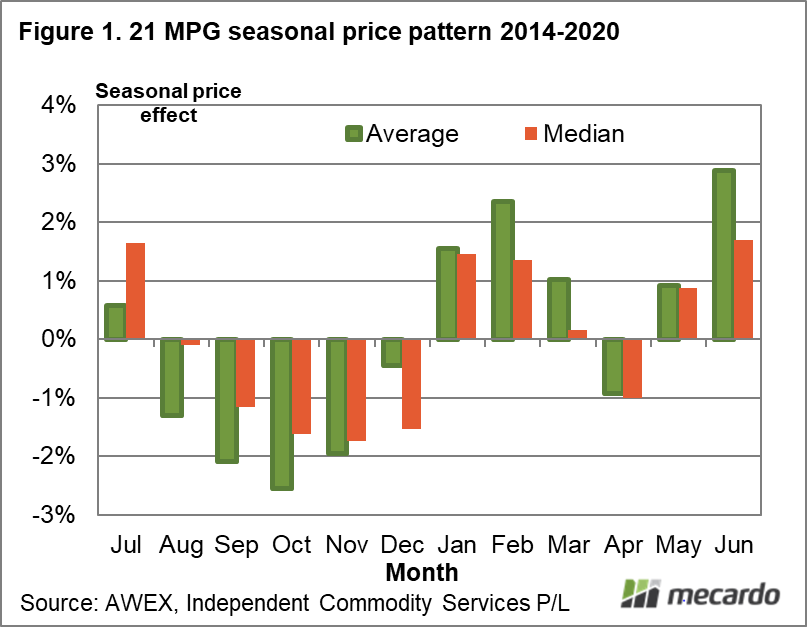
Figure 1 shows the average and median seasonal price pattern for the 21 MPG for the past seven seasons. The average pattern can be pushed around by extreme movements, such as seen in the past 18 months. For this reason, the median seasonal pattern is used, as it gives a view of seasonal pattern unbiased from unusual price movements. As the January article discussed price tends to sag in the spring and then firm early in the new calendar year and then steady, although Easter plays around with the pattern in April.
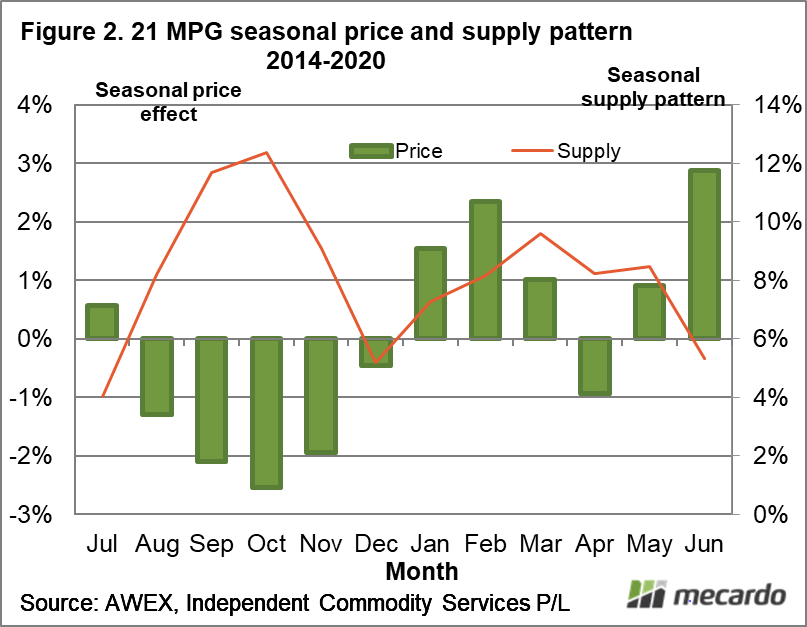
In Figure 2, the median seasonal price pattern for the 21 MPG in Australian dollar terms is compared to the median sale volume pattern for the past seven years. The median proportion of 21-micron wool sold by month for the season is shown, ranging from around 12% in September and October down to 5% in December. There looks to be a clear relationship with the high proportion of wool sold in the Australian spring and the lower seasonal pattern price effect. However, the relationship falls to pieces in the second half of the season. Overall, for the whole season, the supply pattern explains about only 30% of the seasonal price pattern.
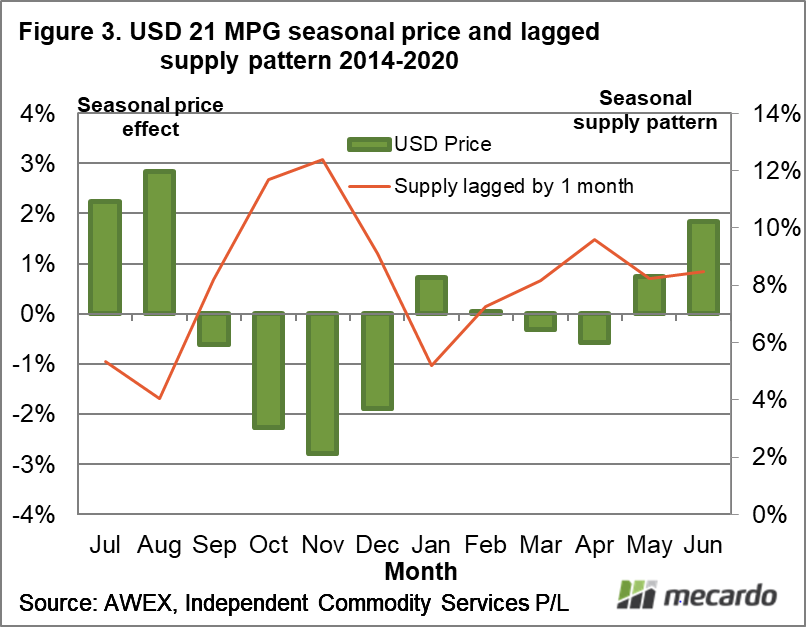
By switching to the seasonal price pattern in US dollar terms, and lagging the supply pattern by one month (for example the November supply pattern is allocated to December) the correlation between seasonal patterns in supply and price improves markedly. Figure 3 compares the seasonal patterns in supply and price with these changes made. Note how the US dollar seasonal pattern is nearly non-existent in the January to April period while the price pattern in the first half of the season is accentuated. Overall, the lagged supply pattern explains around 74% of the US dollar seasonal price pattern.
For South American readers the seasonal price pattern for 21 microns in US dollar terms provides some useful information about likely price movements in the first half of the season, including favourable times to sell and to hold wool.

What does it mean?
In answer to the specific question, there is a high negative correlation between supply and price for the 21-micron category in seasonal pattern terms. It is much less so in Australian dollar terms although, the correlation is quite marked in the spring and non-existent in the second half of the season. The seasonal price pattern in the 21 MPG looks to be primarily drive by supply, with demand a smaller secondary influence.
Have any questions or comments?
Key Points
- In Australian dollar terms supply only accounts for around 30% of the seasonal price pattern evident in the 21 MPG in recent seasons.
- In USD terms the correlation between supply and price for seasonal patterns jumps to 74%.
Click on figure to expand
Click on figure to expand
Click on figure to expand
Data sources: AWEX, Mecardo
