
A subscriber from South America sent a question in recently about seasonal price patterns in the greasy wool market and its effect on prices early in the calendar year. This article takes a look at the seasonal price pattern in the 21 MPG from the mid-1980s onwards in Australian dollar terms.
Seasonal price patterns are repeatable movements in prices associated with time, driven by some mix of supply and demand. The risk to using such patterns when deciding on the timing of sales is that they can be overwhelmed by larger moves in market prices such as major price cycles (view peak to trough article here). The other caveat to using seasonal price patterns as a guide to market timing is that these patterns can change with time.
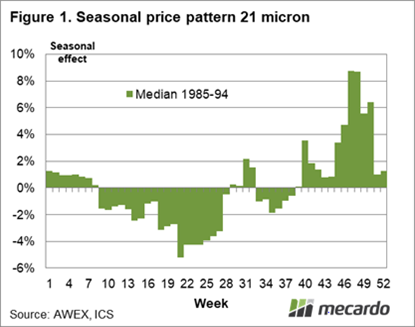
In Figure 1 the weekly median seasonal price effect for the 21 micron indicator in the decade from the mid-1980s to the mid-1990s is shown. The seasonal pattern is the median effect, calculated by using the price variation from a rolling centred 52 week moving average of price, adjusted for trend. It shows the classic price weakness in the spring followed by strong prices in the last quarter of the season, after the Easter recess in sales. In this period supply tended to be skewed to the spring which would help explain the spring weakness. Demand also played a role with the head of Itochu (the leading wool exporter at the time) telling a writer in the mid-1990s that he thought weak demand was the key factor in the low spring prices, a point still supported by some players in the greasy supply chain.
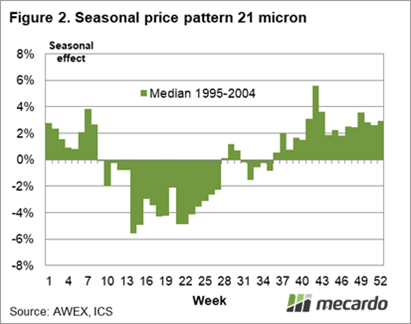
Figure 2 shows the seasonal price pattern for the next decade (mid-1990s to mid-2000s). The spring weakness in price is still evident but the price strength in the second half of the season has spread out and moderated.
Figure 3 looks at the seasonal price pattern in the next decade from the mid-2000s to the mid-2010s. Price weakness in the spring persists with the strength in price in the second half of the season moving back to early in the calendar year. The difference in price from the spring low to the second half high continued to be around 8%.
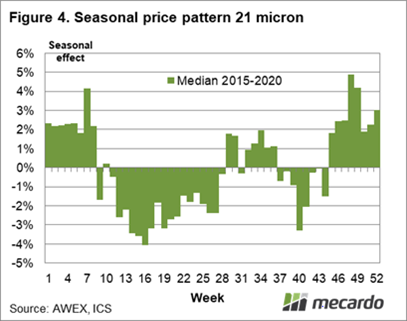
The final schematic in Figure 4 shows the median seasonal price pattern for only the past five seasons, with the exceptional price movements of the past two seasons included. Price weakness in the spring continues to show up, with price strength in the second half of the season variable. The price effect between the spring low and strongest of the second half remains around 8%.
While the seasonal price pattern in the 21 micron indicator has changed during the past 35 years, there have been some constants, chiefly price weakness in the spring. The other constant has been a price effect in the order of 8% between the weakest of the spring prices and the strongest of the prices in the second half of the season. The timing of price strength in the second half of the season has been variable, moving around between decades.

What does it mean?
Seasonal price patterns are a basic guide to some of the expected price movements through the season. Certainly the big drops in price of the past two springs, associated with major cyclical downturns, have timed in with seasonal pattern. When it comes to price patterns in the second half of the season, there has been less consistency across the decades, with the price strength moving from late in the second half to early in the second half.
Have any questions or comments?
Key Points
- Seasonal patterns in prices are not set in stone, they can change.
- For the 21 micron price, spring weakness has been a consistent feature for the past four decades.
- The timing of price strength in the second half of the season has varied between decades.
Note: Week 1 of the wool selling program begins in the first week of July
Click on figure to expand

Click on figure to expand
Data sources: AWEX, ICS, Mecardo


