
Sheep slaughter numbers have fallen heavily this calendar year as late summer/autumn rainfall allowed farmers to move out of drought conditions in many eastern regions. This article takes a look at the slower moving, rolling 12 month calculation of sheep offtake which is a good objective measure of whether the Australian sheep flock is expanding or shrinking.
Mecardo has looked at sheep offtake as a gauge of changes in flock size before (Nov-19) and shown that rainfall (a proxy for seasonal conditions) is a key driver of this measure (Jun-19). Winter/Spring rainfall will be critical in how the current trends in sheep offtake and consequently, changes in flock size, develop.
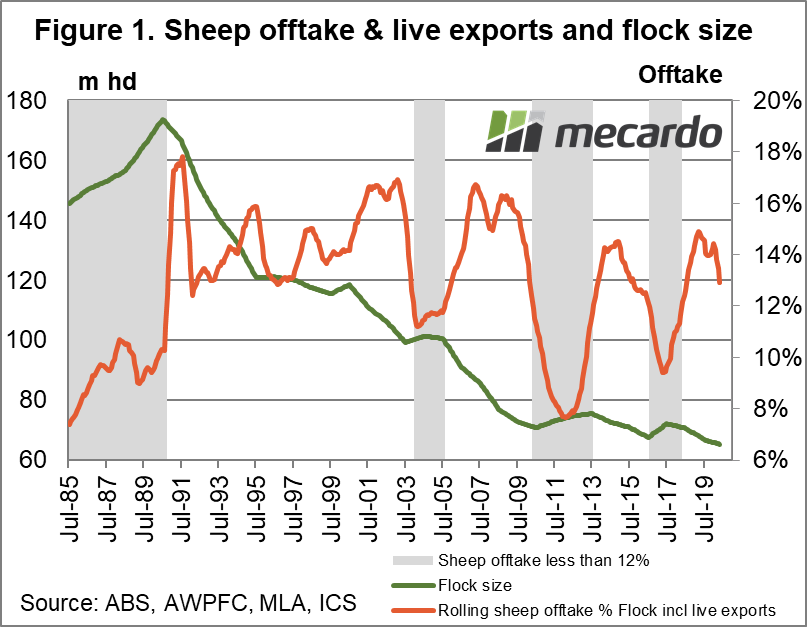
First, a quick refresher of what sheep offtake is. Sheep offtake expresses the rolling 12 month total of adult sheep sold to abattoirs as a proportion of the flock size. Live exports out of eastern Australia are also added as they are quite variable and are lost to farm production. Figure 1 shows the sheep offtake for Australia from the mid-1980s onwards, along with the flock size. Shaded areas in Figure 1 denote periods when the sheep offtake is less than 12%, which is roughly the neutral level. Above 12%, the flock offtake is associated with downward pressure on sheep numbers and below 12% it reflects pressure to build numbers.
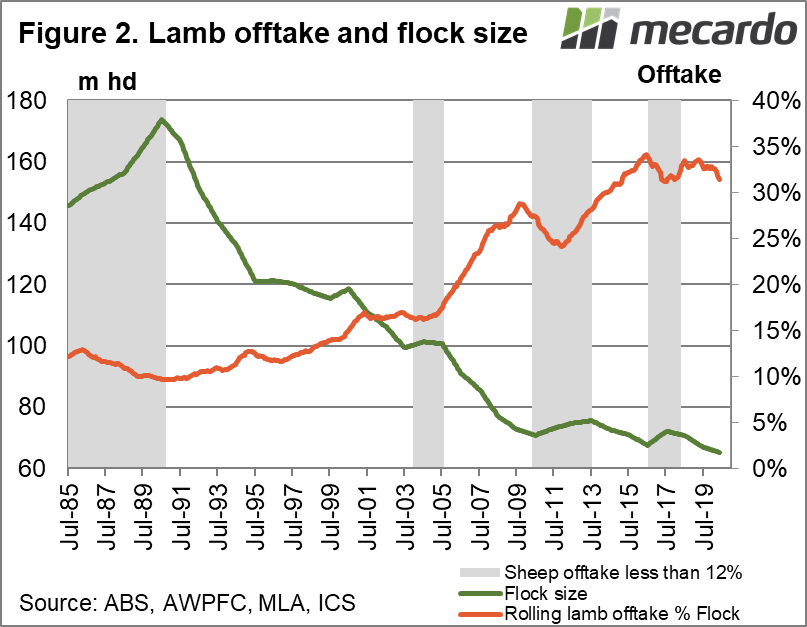
Despite adult sheep slaughter numbers falling heavily in 2020, the sheep offtake measure (measured over a rolling 12 month period) shown in Figure 1 has remained stubbornly at contractionary levels. Figure 2 shows the lamb offtake for the same period. In the three periods of flock expansion during the past two decades, the lamb offtake has steadied once and fallen twice so lamb numbers do play a role in helping to build the flock up.
From the early 1990s to around 2016, lamb offtake trended higher, as the proportion of Merino sheep in the flock fell and the focus on lamb production increased. In that time the lamb offtake rose from around 10% to 32-33%. Since 2016, lamb offtake has steadied in a range of 31% to 34%. In 2020 lamb offtake has dipped towards the lower side of this range, as it did in 2017, which fits with lamb sales being pulled back slightly as the emphasis moves to expanding the flock.
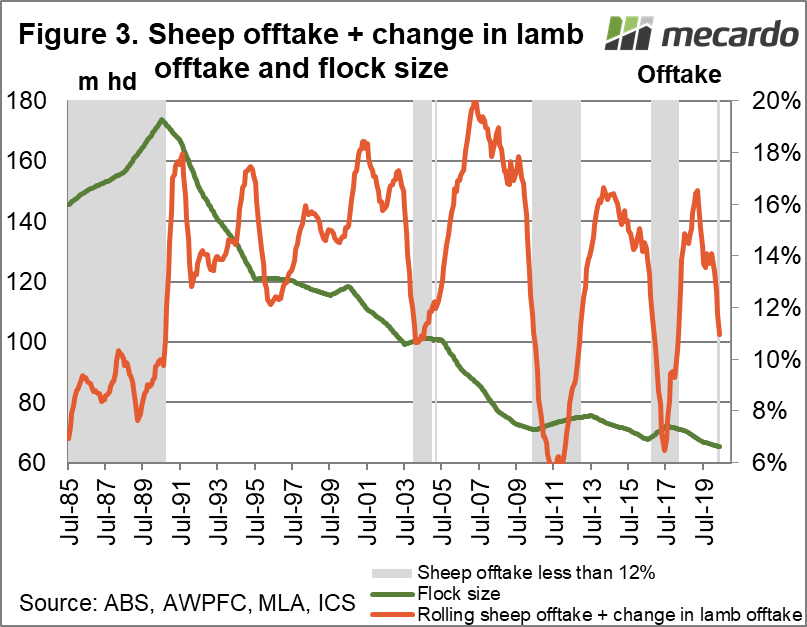
The rising trend in lamb offtake between the early 1990s and 2016 meant that the level of “normal” lamb sales kept changing. With the steadying in the lamb offtake since 2016, it becomes possible to look at combining the change in lamb offtake with the adult sheep offtake. This is done in Figure 3. It is effectively Figure 1 with the year on year change in Figure 2 (lamb offtake) added. Where the lamb offtake was rising strongly, between 2005 and 2010 for example, adding the change in lamb offtake to sheep offtake does not make sense as the flock structure was changing. However, adding the change in lamb offtake looks to help improve our understanding of the forces at work on flock size when an expansion is in progress. In May 2017 the sheep offtake and change in lamb offtake fell to 6.7%, similar to 2011. In the current situation, the combined offtake fell below 12% in April.

What does it mean?
The Australian sheep flock has moved into an expansionary phase, based on early 2020 rainfall. How sheep sales develop from here (and consequently changes on the sheep flock) will depend on winter/spring rainfall in the key sheep regions.
Have any questions or comments?
Key Points
- When changes in lamb offtakes are added to the adult offtake the combined measure indicates the flock moved to an expansion phase in April.
- For the offtake to continue falling we will require reasonable winter/spring rainfall.
- The adult sheep offtake, by itself, has yet to move to expansionary levels.
- The lamb offtake has fallen to the low side of its range which it has been in since 2016.
Click on graph to expand
Click on graph to expand
Click on graph to expand
Data sources: ABS, AWPFC, MLA, ICS


