The Eastern Young Cattle Indicator looks to have peaked, and is likely to fall as the year unfolds, but how far could it go? Historical Value at Risk (VaR) modelling can provide a view on a range of how deep the decline could get over the short run till the end of 2022.
The Eastern Young Cattle Indicator (EYCI) reached yet another all-time high of 910ȼ/kg cwt in late April and has since struggled to break through that level, suggesting it may well have run out of steam.
One thing we can all agree on is that the EYCI’s meteoric rise from early 2020 has been primarily driven by Australian based domestic cattle demand factors, namely a restocking frenzy in response to good pastoral conditions after the drought broke in most cattle regions. As such, it can be said that the rise in young cattle prices has not been driven by global meat prices; which are fundamental to Australia’s export-driven beef industry, but by transitory domestic demand for cattle, that cannot be sustained for long periods of time. Over the long term, Australian cattle prices are set by the global beef market. With Australian cattle currently the most expensive in the world, a decline in cattle prices in Australia seems inevitable to meet the global market, unless world beef prices rise to see cattle values hold.
Value at Risk (or VaR modelling) is a technique that we have borrowed from the banking and finance sector, which is utilised to gauge the level of potential loss exposure that is inherent in an asset, or portfolio of assets. It is utilized as a risk management tool that attempts to measure how much the price of an asset may fall over time based on its previous performance, and can be used to limit potential losses in an enterprise to a level that is not catastrophic for its size, leading to bankruptcy.
Value at Risk Model results produce forecasts of the lowest level, or price, that an asset is expected to reach within a given period, to a particular degree of confidence. By its nature, the model forecasts typically have a downward slope over time, because as time progresses, the potential for multiple negative factors occurring which cause cumulative price declines increases. (In other words, over longer periods of time, there are more opportunities for things to go wrong.)
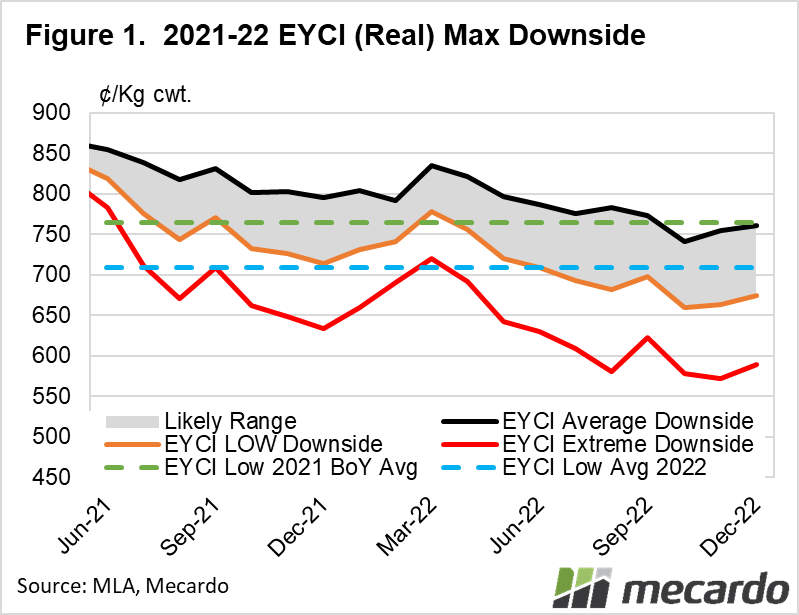
In the VaR model of the EYCI in figure 1, the first question you may have is why there is a noticeably steep drop from the current level to June 21? The answer is that, historically, a decline of 4-9% over 30-60 days is statistically reasonable expectation for the EYCI. The black line represents an “average” forecast expected price fall over time, where there is a 50% chance (confidence interval) the actual price may end up below that level. Next, the orange low downside line is a level where we only expect prices to fall below that level 17% of the time. Finally, the EYCI price is not expected to go below the red extreme downside line more than 2.5% of the time.
The grey shaded range between the black and orange lines represents the model’s prediction that if prices fall (not rise), the EYCI price will be in that range around 70% of the time.
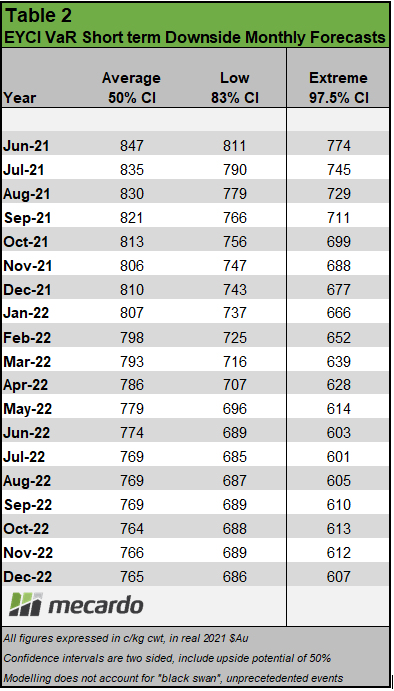
The model’s low downside scenario predicts that for the balance of the 2021 calendar year, the EYCI will not go below an average price of $7.65/kg cwt 83% of the time, and $7.09/kg cwt 83% of the time in 2022.
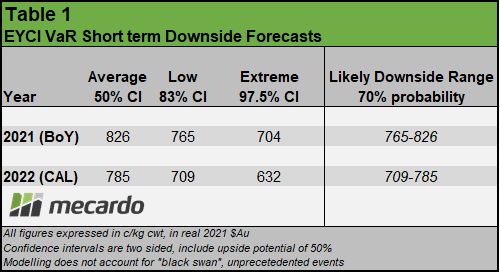
The grey shaded expected range suggests that based on history, assuming that the EYCI falls over the next 2 years, there is a 70% probability that the average monthly price will land in the range $7.65- $8.26 for “balance of year” (BoY) 2021, and $7.09-$7.85 for the calendar year 2022 (Table 1).
It must be noted that the VaR model assumes that prices will definitely fall, is based on past historical behaviour of the EYCI, and does not account for unexpected, unknown, or “Black Swan” events that may occur, that would be detrimental to the price.
2019-2021 have been years marked by unusual events. With the combined impacts of African Swine Fever on global protein markets, Covid-19 and severe destocking followed by widespread favourable seasons, 2021 and 2022 could contain any number of surprises that the model cannot account for.

What does it mean?
If we assume that the EYCI has peaked, and will not deviate from its past price behaviour when falling, the VaR model forecasts that there is a 70% probability that the average EYCI is likely to land in the range $7.65- $8.26 for Balance of Year (BoY) 2021, and $7.09-$7.85 for the calendar year 2022. Be aware though, that prices could continue rising, or dip well below this price range, especially if we see more unusual events in the next couple of years.
Have any questions or comments?

Key Points
- The EYCI is at all-time record levels.
- Historical VaR Model predicts expected maximum downside over time.
- Model Predicts 2021 BoY EYCI at $7.65- $8.26 and 2022 at $7.09-$7.85.
Click to expand
Click to expand
Data sources: MLA, Mecardo