A Mecardo reader has asked for a brief look at the structural change to the Australian merino clip during the past three decades. It is easy to become caught up in the year to year fluctuations in supply and price, losing some of the longer term perspective on how things are changing.
In the past three decades there have been two major changes in the Australian merino clip. It has become smaller in volume and much finer in fibre diameter, with the merino component of the clip dropping from historically high levels of around 95% to 80%. Figure 1 shows the volume by micron category (AWTA core test volumes in farm bales) in 1992-93 and in 2019-20. In 1992-93 the Australian woolclip was 4.6 million bales, which has shrunk by about two thirds to 1.65 million bales last season.
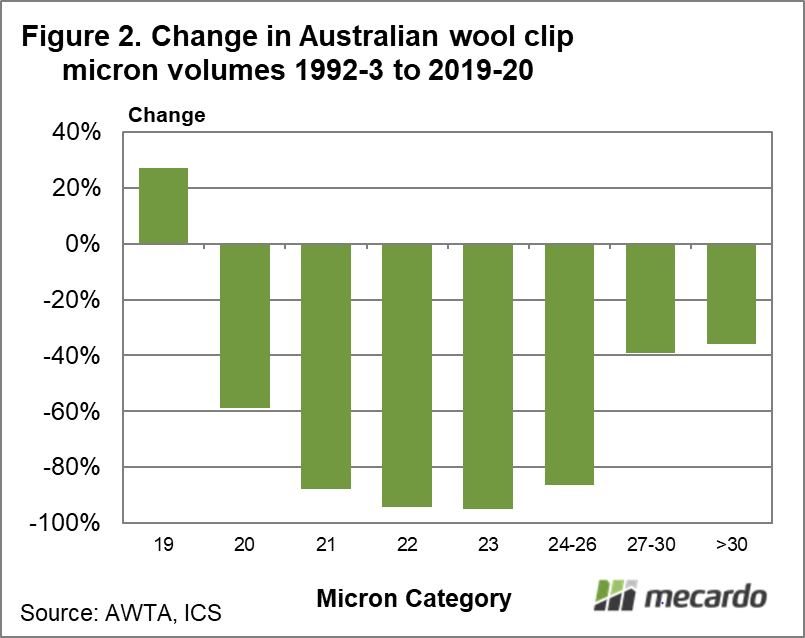
21 through 24-6 micron have been the big losers in volume, falling by 86 to 95%. Figure 2 shows the percentage change in volume by micron (19 micron and broader) between 1992-3 and 2019-20. It has been a brutal drop in supply for 21 to 24-26 micron volumes, with crossbred volumes the remnant supply of the 24-26 micron category. Keep in mind that severe drought in recent years has added to this fall in supply, but the turnaround in seasonal conditions is now reversing some of the recent declines.
As usual the story of supply seen in Australia is echoed in other regions around the world. Wool clips have fined up in other countries such as Uruguay, with famers responding to common price signals.
With the demise of broad merino production since the early 1990s, fine merino volumes have grown. The (now) main merino micron category of 19 micron has increased in volume by 27%, a small change by the standards of the rest of the clip. 18 micron volumes have tripled, while 17 micron supply has increased from 15,000 farm bales to 181,000 farm bales.
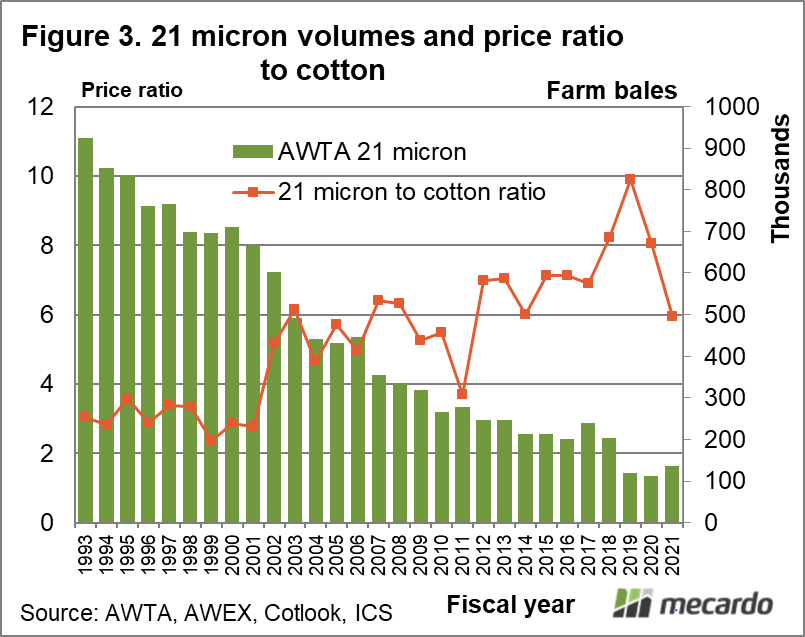
The big changes in supply have had an effect on price. Figure 3 shows the annual (wool selling season) volume of 21 micron in farm bales from 1992-93 to 2019-20 along with the annual price ratio of the 21 micron indicator (MPG) to the Cotlook A Index (cotton). The price ratio spent the 1990s around three, the old benchmark sustainable price ratio. The 1990s were a time of falling production (as shown in Figure 3) which was supplemented by greasy stocks left over from the Reserve Price Scheme. After the stocks were finally liquidated in 2001, prices started to respond to the lower production which is reflected in a rising wool to cotton price ratio in Figure 3. As supply trended lower, the price ratio trended higher with a simple linear trend now around eight times cotton. Notable variations from the trend in the price ratio have been in 2011, when cotton prices rose to their highest levels since the American Civil War, in 2018-19 at the height of the recent rising wool price cycle and now in the time of the COVID-19 pandemic when it has fallen to around six times the cotton price.
If the 21 micron production had remained around 700 to 800,000 bales per year it is quite likely the sustainable 21 micron price ratio would be closer to three. If the Australian clip had shrunk as has happened but kept its average fibre diameter around 21 micron, annual production would be around 330,000 farm bales, and the sustainable price ratio to cotton would have been around five, below the current cyclically depressed price ratio.

What does it mean?
The reduction in supply during the past three decades has allowed the merino clip to sell at higher price ratios to the major fibres such as cotton. While there remains significant variation around sustainable price ratios of wool to other fibres, the trend in these ratios (or sustainable levels) has lifted significantly. The other point to draw from this article is that farm production does respond to price signals and can make massive changes relatively quickly.
Have any questions or comments?
Key Points
- Since the early 1990s the Australian merino wool clip has effectively exited the production of 21 micron and broader wool.
- The Australian clip has shrunk by two thirds since the early 1990s, with all the loss suffered in the 20 micron and broader categories.
- The 19 micron and finer categories have grown in volume since the early 1990s.

Click on figure to expand
Click on figure to expand
Click on figure to expand
Data sources: AWTA, AWEX, Cotlook, ICS