
Following articles about staple strength two weeks ago, a reader asked about seasonal patterns and whether there were any handy rules of thumb which could be used when selling low tensile strength wool. This article seeks to help answer this query.
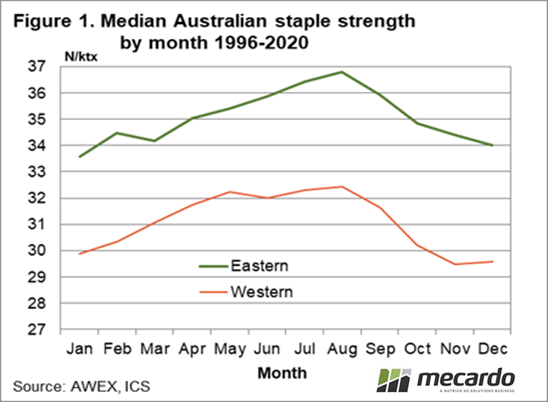
The first part of the question asked was about seasonal patterns of supply and arising from this a seasonal pattern in premiums and discounts which could help in decisions about the timing of sales for low tensile strength wool. There is a consistent seasonal pattern in the staple strength of wool grown in Australia. Figure 1 shows the monthly median staple strength for wool sold in eastern and Western Australia since the mid-1990s. Staple strength peaks in the middle of the calendar year and reaches a low point late in the calendar year in Western Australia and around Christmas in the east.
Following on from Figure 1 is the question “Is there a seasonal pattern in the discounts for low staple strength?” The short answer is no, but the periods of low staple strength do carry more risk of increased discounts turning up. This is a classic each way answer (recall Harry Truman reportedly asking for a one-armed economist so he could get a straight answer) but stick with the article as we delve into this point further.
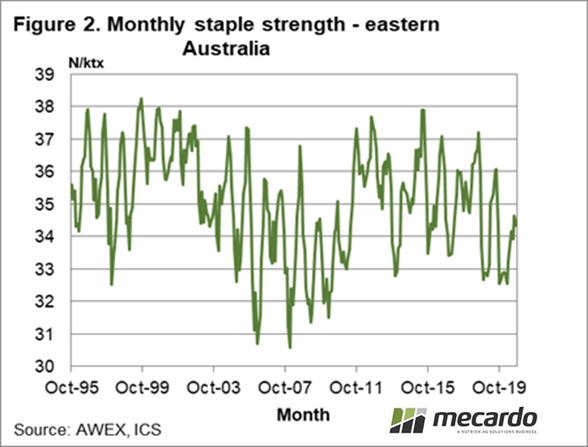
In Figure 2 the monthly staple strength for eastern Australian wool is shown from the mid-1990s onwards. The seasonal pattern shows up but also some bigger variations such as when the staple strength fell after 2003 through to 2010 and then picked up again before easing in recent years. Between seasons the average staple strength in the east has ranged from 31 to 38 N/ktx. Those inter-year variations are greater than the seasonal variations, in the order of four N/ktx, shown in Figure 1. From a processors perspective, the year to year variation can swamp the within-year variation which helps explain why a seasonal variation in staple strength discounts is very weak at best.
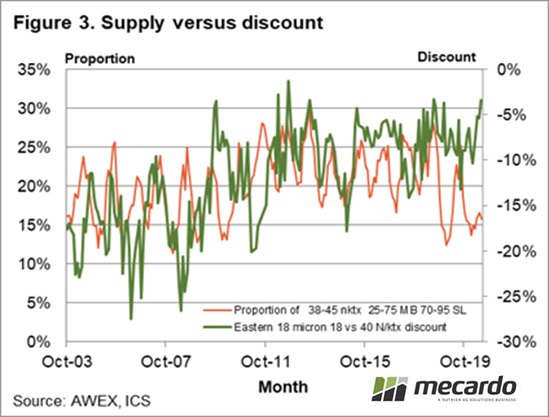
To compare price and staple strength, the proportion of 70-95 mm length Merino fleece wool with a staple strength of 38-45 N/ktx and a mid-point break between 26% and 75% is compared to the discount of 18 micron fleece wool with a staple strength less than 20 N/ktx to wool with a staple strength of 40 N/ktx , Figure 3. The schematic runs from 2003 onwards. It shows periods when the lower proportion of high strength wool is positively correlated with increased discounts (2012-2015 for example) and periods when the correlation is negative (2009-2011 and the current market for example). Hence the each way answer given above. If the correlation is strongly positive then discounts will be greater when the supply of low strength wool is the greatest (late in the calendar year in Western Australia and around Christmas in the east).
In the current market, there seems to be little correlation between supply and discounts, so supply is not a guide to potential discounts in the coming months.

What does it mean?
In years when discounts for staple strength are positively correlated to staple strength, you can use the seasonal pattern in the supply of low strength wool as a guide to likely changes in the discounts, with supply and discounts peaking in the middle of the wool selling season. In other years when the correlation is low (such as this year) the supply of low strength wool matters little.
Have any questions or comments?
Key Points
- Staple strength is higher in the middle of the calendar year and lower towards the end/beginning of calendar years.
- Variation in staple strength can be much greater between years than the normal variation within years.
- There is no consistent relationship between staple strength and discounts for low staple strength.
Click on figure to expand
Click on figure to expand
Click on figure to expand
Data sources: AWEX, ICS, Mecardo


